Sperax: Bullish pennant.Sperax is consolidating in a bullish pennant pattern after a strong recovery rally off the March lows. Price action has tightened between ascending support and descending resistance, forming a textbook continuation setup. Volume has decreased during this compression, which is often a precursor to
SPA / USDT
No trades
Trading activity
Transactions 151
BuysSells
47104
Volume 12.99 KUSD
Buys volumeSells volume
7.85 K5.15 K
Traders 79
BuyersSellers
4138
About SPAUSDT_9400AD.USD
Related DEX pairs

SPA - Next Alt to MOON ??SPA is an altcoin that could make great increases in the near future.
Even though it's currently still trading under the moving averages in the Daily, once it turns there is good upside potential for this alt.
On the bright side, we observe higher lows for SPA:
One should also consider that thi

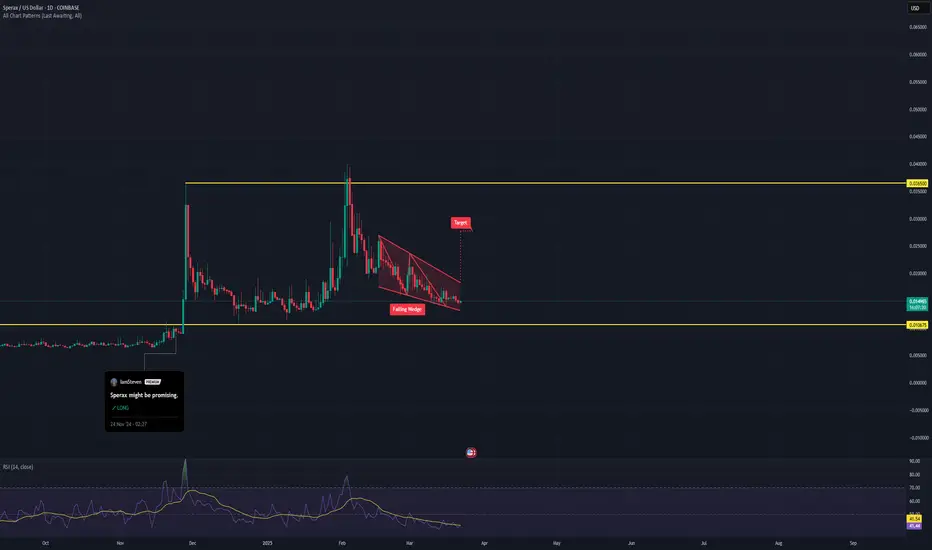
Sperax - Undervalued AF.Despite market chop, SPA is holding strong within a clean falling wedge formation. Im following on from my previous post after a bullish breakout. This move looks far from over. The price action is compressing, volume is thinning, and all signs point to a continuation move on the horizon.
SUPPORT
SPA-Another bullish setup = 3 Take Profits plottedAfter we successfully completed a 100% retest correction for a max gain of 190% we are seeing another bullish swing pattern setting up.
We lost the respect at #3 wave point, it fell into a triangle wedge and squeezed down into an immediate ascending parallel price channel.
Today it has fallen ou

SPA - Bullish Double Bottom wave coming up = 52% gainSPA is setting up a classic Double Bottom pattern which is typically bullish.
Respecting the same ascending parallel price channel since end of last year it will retest the 0.0366 target before this Friday, Valentines Day 2/14.
RSI, MACD showing a flip to positive bullish soon.
Volume is consolid


SPA-Update Retest to $0.04LQ drain down to red box support then quick reversal. On the 15, flashing bullish 200ma crossover. Possible retest back to $0.04
RSI & MACD showing bullish

SPA-Update Retracement PendingDidn't take long for an RSI oversold bought signal to flash as well as Macd bearish pullback. Price convergence with 200MA in the next 24 hours is most likely the scenario as price retraces back into the bearish red box down to $0.26 range.

SPA-Congratulations Followers! We did it..100% Fib CorrectionWhat an exciting investment this SPA trade was!
If tracking from initial callout on 1/16 to current you have a return of 169%, max was 192% in just 19 days. It respected the plotted curved parallel price channel beautifully and showed us the most likely path to success. Patience pays off.
This i

SPA-We hit 3rd Take Profit, 29% gain/91% total6 days earlier than plotted we breached the 3rd take profit target for a grand total of 91% gain if tracking from first post.
If we stretch out another TP that would be at the 100% Fibonacci correction line.

See all ideas
Summarizing what the indicators are suggesting.
Oscillators
Neutral
SellBuy
Strong sellStrong buy
Strong sellSellNeutralBuyStrong buy
Oscillators
Neutral
SellBuy
Strong sellStrong buy
Strong sellSellNeutralBuyStrong buy
Summary
Neutral
SellBuy
Strong sellStrong buy
Strong sellSellNeutralBuyStrong buy
Summary
Neutral
SellBuy
Strong sellStrong buy
Strong sellSellNeutralBuyStrong buy
Summary
Neutral
SellBuy
Strong sellStrong buy
Strong sellSellNeutralBuyStrong buy
Moving Averages
Neutral
SellBuy
Strong sellStrong buy
Strong sellSellNeutralBuyStrong buy
Moving Averages
Neutral
SellBuy
Strong sellStrong buy
Strong sellSellNeutralBuyStrong buy