GOLD 1H CHART ROUTE MAP UPDATE & TRADING PLAN FOR THE WEEKHey Everyone,
Please see our 1h chart levels and targets for the coming week, which is still active and in play.
We are seeing price play between two weighted levels with a gap above at 4221 and a gap below at 4169, as support. We will need to see ema5 cross and lock on either weighted level to determine the next range.
We will see levels tested side by side until one of the weighted levels break and lock to confirm direction for the next range.
We will keep the above in mind when taking buys from dips. Our updated levels and weighted levels will allow us to track the movement down and then catch bounces up.
We will continue to buy dips using our support levels taking 20 to 40 pips. As stated before each of our level structures give 20 to 40 pip bounces, which is enough for a nice entry and exit. If you back test the levels we shared every week for the past 24 months, you can see how effectively they were used to trade with or against short/mid term swings and trends.
The swing range give bigger bounces then our weighted levels that's the difference between weighted levels and swing ranges.
BULLISH TARGET
4221
EMA5 CROSS AND LOCK ABOVE 4221 WILL OPEN THE FOLLOWING BULLISH TARGETS
4250
EMA5 CROSS AND LOCK ABOVE 4250 WILL OPEN THE FOLLOWING BULLISH TARGETS
4284
EMA5 CROSS AND LOCK ABOVE 4284 WILL OPEN THE FOLLOWING BULLISH TARGETS
4320
EMA5 CROSS AND LOCK ABOVE 4320 WILL OPEN THE FOLLOWING BULLISH TARGETS
4361
BEARISH TARGETS
4169
EMA5 CROSS AND LOCK BELOW 4169 WILL OPEN THE SWING RANGE
4130
4093
EMA5 CROSS AND LOCK BELOW 4093 WILL OPEN THE SECONDARY SWING RANGE
4049
4015
As always, we will keep you all updated with regular updates throughout the week and how we manage the active ideas and setups. Thank you all for your likes, comments and follows, we really appreciate it!
Mr Gold
GoldViewFX
Trade ideas

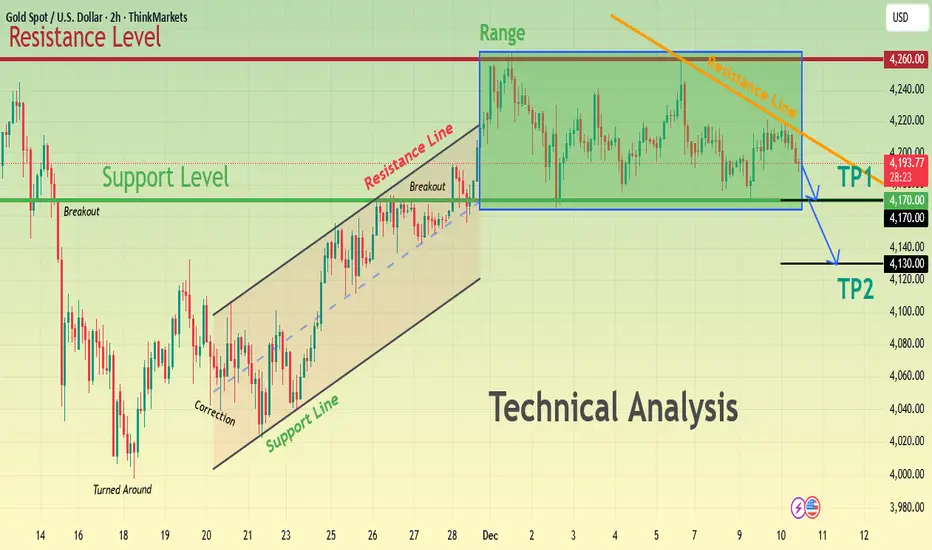
XAUUSD Range Resistance Holds — Pullback Toward $4,170 in FocusHello, traders! Here’s my technical outlook on GOLD (XAUUSD) based on the current market structure visible on the chart. After a strong rebound from the previous lower demand area, price moved into a steady ascending structure, respecting the rising Support Line and forming higher highs and higher lows. This bullish impulse later transitioned into a corrective consolidation, where Gold entered a well-defined range below the major 4,260 resistance level. The repeated rejection from this resistance confirms strong selling pressure at the top of the range, while buyers continue to defend the 4,170 support level, keeping price compressed between these key boundaries.Currently, XAUUSD is trading inside this consolidation box, while also respecting the descending short-term resistance line from the recent swing highs. The market previously broke out from the bullish channel and is now showing signs of weakness beneath the upper boundary of the range, suggesting that upside momentum is fading. As long as price remains capped below 4,260, the risk of a deeper corrective move remains elevated.My primary scenario is bearish as long as Gold stays below the 4,260 resistance and continues to respect the descending resistance line. I expect price to gradually move lower toward the TP1 target at 4,170, which is the first key support inside the structure. If selling pressure accelerates and this level fails to hold, the next downside objective stands at TP2 around 4,120, where stronger demand could emerge. A clear breakdown below TP1 would confirm bearish continuation. However, if price reclaims 4,260 with strong momentum, this bearish setup would be invalidated and the bullish trend could resume. For now, the structure favors a corrective pullback toward 4,170–4,120. Please share this idea with your friends and click Boost 🚀
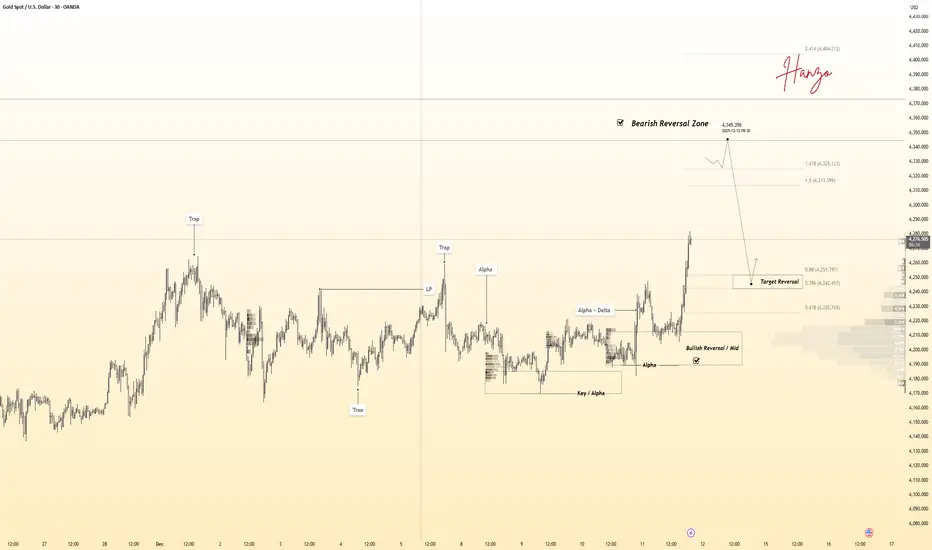
Gold 30Min Engaged ( Bearish Volume Reversal entry Detected )⚡Base : Hanzo Trading Alpha Algorithm
The algorithm calculates volatility displacement vs liquidity recovery, identifying where probability meets imbalance.
It trades only where precision, volume, and manipulation intersect —only logic.
✈️ Technical Reasons
/ Direction — SHORT / Reversal 4345 Area
☄️Bearish rejection confirmed through sharp candle body.
☄️Lower-high forming beneath resistance supply region.
☄️Volume decreasing confirms exhaustion in price rally.
☄️Sellers regained imbalance with heavy top rejection.
☄️Algorithm detects fading demand and shift to control.
⚙️ Hanzo Alpha Trading Protocol
The Alpha Candle defines the day’s real control zone — the first battle of momentum.
From this origin, the Volume Window reveals where the next precision strike begins.
⚙️ Hanzo Volume Window / Map
Window tracked from 10:30 — mapping true market behavior.
POC alignment exposes institutional bias and breakout potential zones.
⚙️ Hanzo Delta Window / Pulse
Delta window monitors real buying vs. selling power behind each move.
Tracks volume aggression to expose who controls the candle — buyers or sellers.
When Delta aligns with Volume Map, momentum becomes undeniable.
Gold 30Min Engaged ( Bullish Volume Reversal entry Detected )⚡Base : Hanzo Trading Alpha Algorithm
The algorithm calculates volatility displacement vs liquidity recovery, identifying where probability meets imbalance.
It trades only where precision, volume, and manipulation intersect —only logic.
✈️ Technical Reasons
/ Direction — LONG / Reversal 4211Area
☄️Bullish momentum confirmed through strong candle body.
☄️Structure shifted with higher-low near key demand base.
☄️Volume expanding confirms order-flow alignment upward.
☄️Buyers reclaimed imbalance with sustained clean break.
☄️Algorithm detects rising momentum under low liquidity.
⚙️ Hanzo Alpha Trading Protocol
The Alpha Candle defines the day’s real control zone — the first battle of momentum.
From this origin, the Volume Window reveals where the next precision strike begins.
⚙️ Hanzo Volume Window / Map
Window tracked from 10:30 — mapping true market behavior.
POC alignment exposes institutional bias and breakout potential zones.
⚙️ Hanzo Delta Window / Pulse
Delta window monitors real buying vs. selling power behind each move.
Tracks volume aggression to expose who controls the candle — buyers or sellers.
When Delta aligns with Volume Map, momentum becomes undeniable.

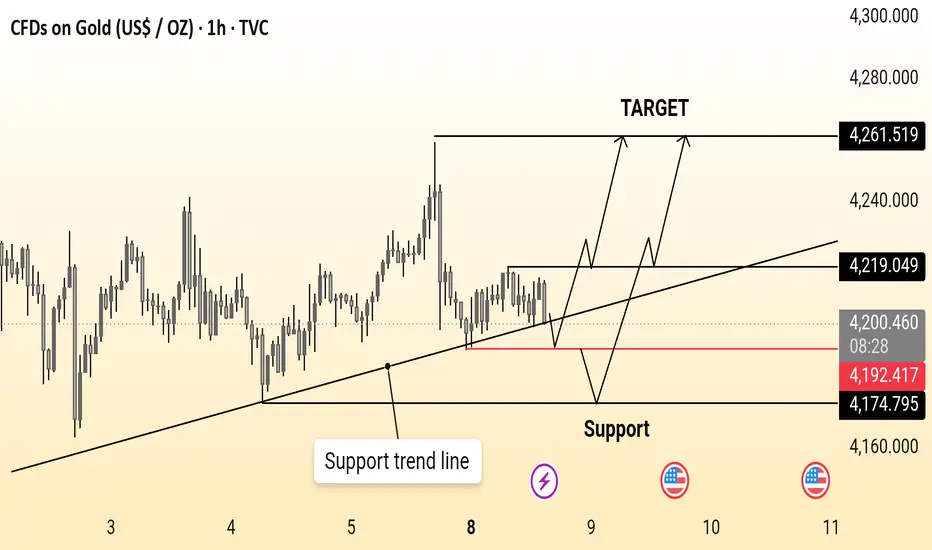
Gold ideaGold (1H) is holding above a rising support trend line, maintaining a bullish structure. As long as price stays above the 4,174–4,192 support zone, a move toward 4,261 remains likely.
GOLD → Price within range ahead of Fed meeting FX:XAUUSD is consolidating within a wide range amid expectations of the Fed's interest rate meeting. The fact that interest rates will be lowered has most likely already been factored in by the market. There is a possibility of a long squeeze...
New threats of tariffs by Trump (on fertilizers from Canada and against Mexico) are weakening the dollar and supporting gold.
As for interest rates, the Fed is expected to cut rates by 25 basis points, but the market has most likely already priced in the cut. Accordingly, there may be countertrend movements (MM traps) to accumulate liquidity before further advances.
Today's JOLTS data on job vacancies may cause increased volatility. According to statistics, before and after interest rate cuts, gold forms a swing correction, within which it may test the support of the range against the backdrop of a bullish trend...
Resistance levels: 4219.5, 4256
Support levels: 4200, 4180, 4163
Ahead is a strong liquidity zone at 4220, and the retest may end in a decline. MM may continue to accumulate liquidity before further advancement. I expect a retest of the range support with the aim of retesting the liquidity pool at 4175-4165 before a possible rise.
Best regards, R. Linda!

Lingrid | GOLD Sideways Movement Ahead of FOMC DecisionOANDA:XAUUSD perfectly played out my previous trading idea . Price is holding inside a well-defined consolidation after its prior surge, with price rotating above the rising channel base. The trend remains constructive, but momentum has cooled, suggesting participants are waiting for a catalyst rather than committing aggressively.
If buyers continue to defend the trendline and the lower boundary of the range, gold could attempt another gradual push toward the upper resistance near 4,300. A brief dip toward the channel support may occur to gather liquidity, potentially offering a better positioning point before any renewed upside attempt.
➡️ Primary scenario: support holds near 4,160 → rotation higher toward 4,300.
⚠️ Risk scenario: a sustained breakdown below the channel could weaken the bullish structure.
If this idea resonates with you or you have your own opinion, traders, hit the comments. I’m excited to read your thoughts!

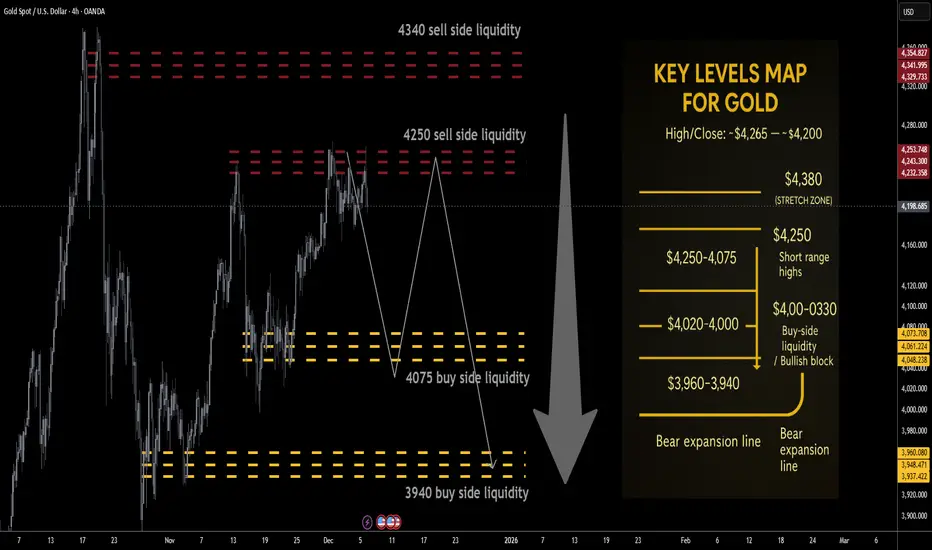
Gold next week Key S/R Levels and Outlook for Traders🔥 GOLD WEEKLY SNAPSHOT — BY PROJECTSYNDICATE
🏆 Swing High / Swing Low
$4,265 → ~$4,164 — clean rejection from the 4,26x breakout zone with a long upper wick, but weekly close still near $4,200, keeping price pinned in the upper part of the broader $4k range.
📈 Trend
Higher-timeframe: Structural bull trend intact while price holds above the $3,940–$4,000 block.
Tactical: Last week’s failed extension above $4,250 and the close back near $4,200 tilt the tape into distributive mode:
Rallies into $4,250 / $4,340 = sell-side liquidity magnets.
Downside liquidity sits lower at $4,075 / $3,940, making upside risk/reward look asymmetric to the downside from current levels.
🛡 Supports – Buy-Side Liquidity / Downside Objectives
$4,130–$4,100:
Short-term intraday pivot where buyers repeatedly stepped in last week; first micro-reaction zone on any flush.
$4,090–$4,075 🟢 Buy-side liquidity #1
First true BSL pocket below the close; ideal TP1 for shorts from above and a spot where responsive dip-buyers are likely to probe.
$4,020–$4,000:
Psychological shelf; loss of 4k would confirm that local distribution is winning and open the deeper BSL run.
$3,960–$3,940 🟢 Buy-side liquidity #2 / structural block
Higher-timeframe demand and key liquidity magnet for a fuller corrective leg. A sustained break/acceptance below $3,940 would signal that the 2025 blow-off is transitioning into broader mean-reversion rather than shallow consolidation.
🚧 Resistances – Sell-Side Liquidity / Short-Side Focus
$4,220–$4,250 🔴 Sell-side liquidity #1
First overhead supply from the prior week’s failed breakout structure and just under recent highs. Clean area for “sell the rip” probes and for late longs to de-risk.
$4,300–$4,340 🔴 Sell-side liquidity #2
Extension / SLI pocket aligned with the upper part of last week’s range and just below the prior $4,38x–$4,40x all-time high band. Ideal for scaling adds if a news-driven squeeze runs stops above 4,250.
Stretch: $4,380–$4,400:
Prior record spike / stop-run area; only expected on a full-on squeeze into the Fed, but a tag here would likely be exhaustion rather than a new sustainable trend leg higher.
🧭 Bias Next Week
Base tactical bias: fade strength / short rallies, not chase upside.
the tape favors a liquidity grab higher → rotation lower scenario:
Look for wicks into $4,220–$4,340 to be sold.
Downside path of least resistance: $4,090–$4,075 → $4,020–$4,000 → $3,960–$3,940.
⚖️ Base Case Scenario
Open/early week:
Price opens near $4,200 and either trades flat or spikes briefly into $4,220–$4,250 on weekend gap/early flow.
Liquidity sweep into resistance:
Rejection from SLI:
Failure to accept above $4,250/4,300 leaves upper wicks on 4H/daily, signaling distribution.
Rotation into BSL:
First objective: $4,090–$4,075 (TP1)
Secondary objective: $4,020–$4,000 (TP2)
Stretch / full flush: $3,960–$3,940 (TP3) into the structural demand block and buy-side liquidity pocket.
🚀 Breakout / Invalidation Trigger
Bearish framework invalidation:
A strong daily/weekly acceptance above $4,380 would imply shorts caught offside and re-open the path toward $4,450+ in line with the higher Street targets for 2026.
In that case, shift from short-the-rip → neutral / buy shallow pullbacks until a new top structure forms.
🔓 Bull / Bear Trigger Lines
Structural bull line:
Above $3,940–$4,000: long-term bull structure remains intact. Even if you’re tactically short, treat deep moves into this area with respect – this is where higher-timeframe players are likely to re-accumulate.
Bear expansion line:
Below $3,940: opens scope for a faster liquidation wave toward $3,880–$3,850 and potentially a broader 2025–26 consolidation phase instead of immediate continuation higher.
🧭 Recommended Strategy – Short at Market Open
⚠️ Illustrative trade plan, not financial advice. Size and risk-manage according to your own rules.
1️⃣ Primary Short – Open + Fade the Rips
Short at/near market open around the $4,195–$4,210 zone if price opens below $4,220 and orderflow confirms rejection of higher bids.
Add / build zones:
Add 1: into $4,220–$4,250 (first SLI band / prior breakout zone).
Add 2 (only if spike): $4,300–$4,340 (second SLI; look for clear blow-off / stop-run behavior before loading the last clip).
Stops / invalidation:
Tactical stop: hard stop above $4,380.
More conservative: soft line at $4,340, hard stop $4,390–$4,400 to allow for intraday wicks.
Targets (aligned with buy-side liquidity):
TP1: $4,090–$4,075 → take partials and reduce risk.
TP2: $4,020–$4,000 → core target for the week if distribution plays out.
TP3: $3,960–$3,940 → full BSL sweep into structural demand; expect responsive buying attempts here.
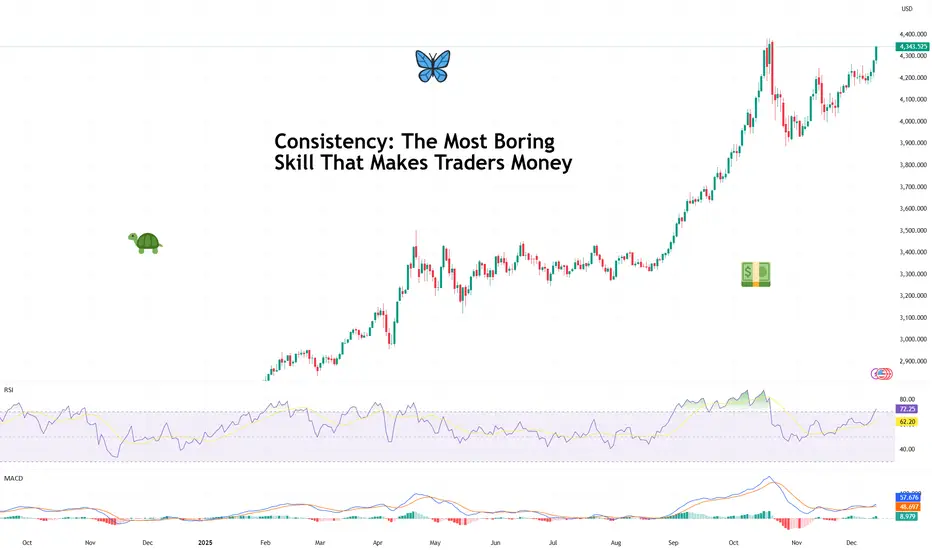
Consistency: The Most Boring Skill That Makes Traders MoneyAsk traders how they made their money and you’ll hear stories about perfect entries, heroic conviction, and that one legendary going-for-the-jugular trade they’ll mention at every dinner party.
What you almost never hear about is consistency — because it’s not glamorous, it doesn’t screenshot well, and it definitely doesn’t come with fireworks.
But consistency is the skill that turns trading from an emotional roller coaster into a durable business. It’s boring. It’s repetitive. And it’s responsible for more profitable careers than any secret indicator ever will.
🧠 Why the Market Rewards the Unexciting
Markets don’t pay you for being clever. They pay you for being repeatable.
Consistency works because markets are probabilistic systems. No single trade matters in the long run. What matters is what happens over time, across dozens or hundreds of decisions. (Good time to look back and see how you did this year.)
The trader who makes reasonable decisions again and again — even without brilliance — will eventually outperform the trader who occasionally nails a perfect call but can’t stop freelancing.
Think of it less like poker and more like compound interest. It doesn’t wow you at first. Then one day, you realize you’ve done pretty darn well.
📊 The Myth of the Big Trade
Every trader remembers their biggest win. And there’s nothing wrong with that. Some big trades can pay for a lot of small mistakes .
Big wins feel validating. They trigger confidence. But they also create dangerous expectations. Traders start chasing that feeling — trading bigger, faster, looser — and consistency quietly exits through the back door.
Professional traders know that a great trade doesn’t prove skill. A series of disciplined trades does.
The market doesn’t care how exciting your best trade was. It cares how well you behaved on the other ninety-nine.
🧮 Consistency Is Math, Not Motivation
Consistent traders don’t wake up feeling like it’s their lucky day.
They operate within a framework that reduces randomness in their decisions. They trade fewer setups, not more. They accept that being flat for the week is a position. They understand that not every day is designed to reward them.
This isn’t about grinding harder. It’s about removing unnecessary choices so execution becomes automatic.
Ironically, the less you try to be exceptional, the more real and reliable your results become.
📉 Losing Is Part of the Job
Consistency shows up most clearly during losing streaks. Anyone can look disciplined after a winning week. The test comes when trades stop working, narratives shift, and the urge to “make it back” creeps in.
Consistent traders don’t panic. They don’t revenge trade . They don’t rewrite their strategy after three red days.
Instead, they understand that drawdowns are not failures — they’re rent paid for staying in the game. The goal isn’t to avoid losses. It’s to keep losses from changing behavior.
🧠 Confidence Comes from Repetition
One of the quiet benefits of consistency is confidence — the real kind. Not the loud, chest-thumping confidence that comes from a hot streak. But the calm assurance that comes from knowing you’ve executed your plan a hundred times before.
That confidence allows traders to stay neutral when others get emotional. To reduce size when conditions change. To wait without feeling left out.
It’s the difference between reacting to the market and responding to it. Regardless if it’s fever-pitch earnings season or the Economic Calendar is jam-packed with events.
🕰️ The Long Game Always Wins
With that in mind, trading careers aren’t built in viral moments. They’re built in years upon years of working on your craft.
The traders who last aren’t necessarily the smartest or fastest. They’re the ones who made it boring enough to sustain it. And eventually, almost accidentally, the process builds itself into something that looks a lot like success.
Off to you : What’s your consistency strategy saying? Is boring beautiful or is risk-taking maxed out in your portfolio? Share your thoughts in the comments!
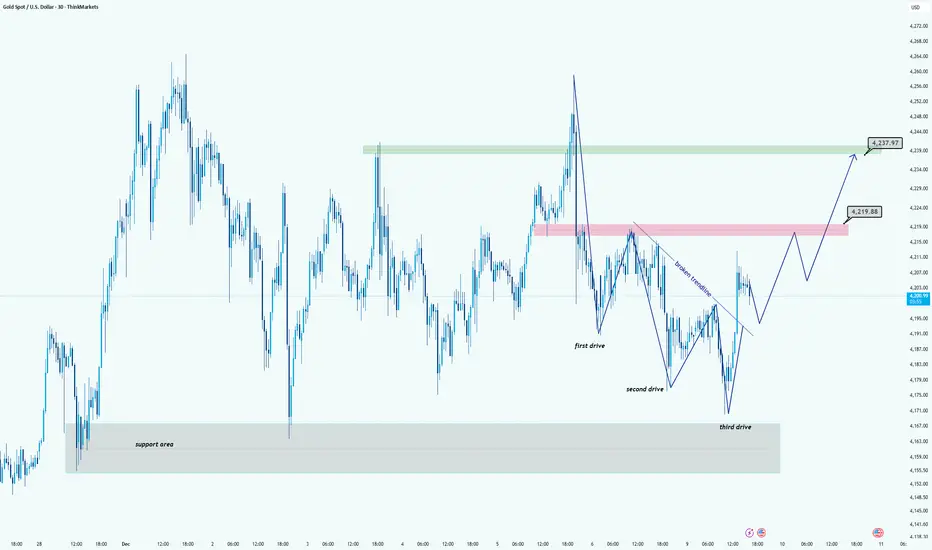
XAUUSD (GOLD) Trend Shift Confirmed After Third Drive ReactionHi!
Gold has completed a clear Three-Drive Reversal pattern, with the third drive tapping into the major support zone around 4165–4175. This area has repeatedly acted as a strong demand pocket, and the sharp reaction confirms buyers are still active. Following the third drive, price broke the minor descending trendline, signaling the first shift in short-term momentum.
Current Structure
After breaking the trendline, price is now forming a healthy sequence of higher lows. The next key area is the mid-range supply zone at 4215–4220 (highlighted in red). A controlled pullback into higher-low structure would maintain bullish pressure and build the base for continuation.
Upside Targets
If buyers successfully reclaim the 4215–4220 zone, the next major target sits at the 4237–4240 resistance (green zone). This aligns with the next liquidity cluster and previous strong reaction points.
⚠️ Validation
The bullish scenario remains valid as long as price holds above the structure created after the third drive. A heavy rejection back below the support zone would invalidate the setup.
Disclaimer: As part of ThinkMarkets’ Influencer Program, I am sponsored to share and publish their charts in my analysis.
XAUUSDHello Traders! 👋
What are your thoughts on GOLD?
As seen on the chart, Gold (XAUUSD) has been trading within a defined range for the past two weeks, showing choppy price action without a clear trend direction.
Short-Term Strategy (Range Bound):
As long as the price remains within this box, the optimal strategy is to trade the boundaries:
• Short: At the resistance zone
• Long: At the support zone
Trend Strategy (Breakout Setup):
For a directional move, we need to wait for a valid breakout from this consolidation structure:
1-Bullish Scenario (Higher Probability ):A breakout above the current resistance zone will likely push the price toward the Previous High.
2-Bearish Scenario: A breakdown below the current support zone will expose the lower Target Support Area.
Always wait for candle confirmation before entering breakout trades.
Don’t forget to like and share your thoughts in the comments! ❤️

XAUUSD: Buying Pressure Aims for the $4,260 ResistanceHello everyone, here is my breakdown of the current Gold (XAUUSD) setup.
Market Analysis
Gold continues to trade within a broader bullish structure, with price action developing inside a well-defined ascending channel. After the previous impulse move higher, the market entered a consolidation phase below the $4,260 Resistance Zone, where sellers repeatedly defended the level. Earlier, XAUUSD produced a breakout from the upward channel structure and formed a temporary base above the mid-support area near $4,200, confirming that buyers still control the broader trend.
Currently, price is holding above the Triangle Support Line, showing that demand remains active on dips. The recent pullback into the $4,200–$4,190 support area looks corrective rather than impulsive, suggesting that bearish pressure remains limited for now. As long as price stays above this triangle support, the bullish market structure remains valid.
My Scenario & Strategy
My scenario is bullish while XAUUSD holds above the $4,200 Support Zone and respects the Triangle Support Line. I expect price to stabilize in this area and attempt a renewed push toward the $4,260 Resistance Zone, which is the key barrier for continuation.
Therefore, a clean breakout above $4,260 would confirm bullish continuation and open the door for further upside expansion toward higher historical levels. However, if price fails to hold the triangle support and breaks below $4,190–$4,180, this would weaken the bullish structure and could trigger a deeper corrective pullback toward the lower channel boundary. For now, the market maintains a long bias, with the main objective being a renewed test and potential breakout of the $4,260 resistance zone.
That’s the setup I’m tracking. Thank you for your attention, and always manage your risk.

Gold 30-Min — Volume Buy Reversal Triggered⚡Base : Hanzo Trading Alpha Algorithm
The algorithm calculates volatility displacement vs liquidity recovery, identifying where probability meets imbalance.
It trades only where precision, volume, and manipulation intersect —only logic.
✈️ Technical Reasons
/ Direction — LONG / Reversal 4185 Area
☄️Bullish momentum confirmed through strong candle body.
☄️Structure shifted with higher-low near key demand base.
☄️Volume expanding confirms order-flow alignment upward.
☄️Buyers reclaimed imbalance with sustained clean break.
☄️Algorithm detects rising momentum under low liquidity.
⚙️ Hanzo Alpha Trading Protocol
The Alpha Candle defines the day’s real control zone — the first battle of momentum.
From this origin, the Volume Window reveals where the next precision strike begins.
⚙️ Hanzo Volume Window / Map
Window tracked from 10:30 — mapping true market behavior.
POC alignment exposes institutional bias and breakout potential zones.
⚙️ Hanzo Delta Window / Pulse
Delta window monitors real buying vs. selling power behind each move.
Tracks volume aggression to expose who controls the candle — buyers or sellers.
When Delta aligns with Volume Map, momentum becomes undeniable.

GOLD → Consolidation ahead of the Fed's interest rate decision FX:XAUUSD is rebounding from resistance at the local range of 4220 and heading towards support at the liquidity zone of 4175. Ahead is the Fed meeting on interest rates, where rates are likely to be lowered. What to expect?
The probability of a 25 bp rate cut today is ≈90%. JOLTS job vacancy data reduced the chances of easing in January to ≈20%. Attention is shifting to the Fed's rate forecasts for 2026 and the tone of Powell's comments — the balance of votes in the FOMC (the ratio of “hawks” to “doves”) will determine the further course.
In the current case, it is worth looking not only at the fact of the rate cut, which is most likely already priced in. What is important to us are the regulator's comments and political stance. If they say that the pace of rate cuts will slow down in the future, the dollar may fly up and gold down.
If they support further rate cuts, the dollar will go down and gold up.
Resistance levels: 4220, 4266
Support levels: 4200, 4175, 4165
It would be a shock to the market if rates were cut by 50 points; the chances are slim, but they exist. In this case, gold would soar. However, the most likely scenario is described above.
Technically, I expect a retest of the trading range support; in the worst case, gold may fall to 4140 - 4120 - 4100 before rising. High volatility is possible in the evening!
Best regards, R. Linda!

Lingrid | GOLD Ranging Market Remains in PlayOANDA:XAUUSD continues to rotate between well-defined resistance near 4260–4270 and demand around 4160–4170, confirming a sustained sideways environment. Repeated rejections from the upper boundary and controlled pullbacks suggest neither side has full control yet. The recent A-B-C decline fits a corrective move inside the broader consolidation rather than a trend reversal.
Price is now pressing into the lower range support, aligned with channel border and historical reaction zone. A structural hold here could trigger another rotation higher toward 4,212, while sellers are likely to re-engage near the upper band. Until a decisive breakout occurs, fading the range edges offers the higher-probability setups.
➡️ Primary scenario: hold above 4160 → bounce toward 4,212
⚠️ Risk scenario: clean loss of 4160 shifts focus to deeper downside and range breakdown potential
If this idea resonates with you or you have your own opinion, traders, hit the comments. I’m excited to read your thoughts!

Lingrid | GOLD Possible Price Acceleration After Range BreakOANDA:XAUUSD perfectly played out my previous trading idea . Price could be transitioning from pullback into continuation, following a clean expansion above the prior consolidation zone. The recent surge developed after a series of higher lows along rising support, while the breakout candle shows strong follow-through rather than exhaustion. Price behavior suggests the earlier pullbacks were corrective pauses, not distribution.
If buyers continue to defend the 4,250 demand pocket and volatility remains compressed above the former ceiling, TVC:GOLD may extend toward the upper channel boundary around where supply previously emerged. That zone may act as the next reaction point as momentum stretches.
➡️ Primary scenario: hold above 4,250 → advance toward 4,320.
⚠️ Risk scenario: a sustained slip below 4,235 may weaken bullish structure and reopen the 4,170 support area.
If this idea resonates with you or you have your own opinion, traders, hit the comments. I’m excited to read your thoughts!
GOLD (XAU/USD): Day Trading Setup for Today📈GOLD is currently consolidating within a horizontal intraday range.
Following a test of the channel's support, the price may continue to ascend towards its resistance.
As a confirmation, I observe a head and shoulders pattern formation.
Target - 4255

XAUUSD (Gold) Next Buying Move Analysis Quick Analysis (XAUUSD / Gold)
Price recently pulled back into a marked support zone (the blue highlighted area).
The chart suggests bullish continuation, with two possible upward paths drawn.
As long as price stays above the support zone, the idea points toward a move up toward the marked target area.
Support Zone
Price is expected to bounce from this level. If it breaks below, the bullish setup weakens.
Target Zone
The purple box shows the projected upside 4350 Target.
Summary
Idea: Buy-from-support continuation.
Wait for a confirmed bounce from support → aim for the target zone → watch for any break below support.
❤️ please support with Boost and Comment I will be Glad ❤️

Lingrid | GOLD Weekly Analysis: Calm Before the Fed-Driven StormOANDA:XAUUSD price action this week has been a masterclass in consolidation, trading in a tight, choppy range just around $4,200 technical level. This sideways movement is not a sign of weakness but rather a necessary pause after the recent parabolic rally, allowing traders to digest gains and build fresh momentum. The market has found a solid floor at the $4,150 zone, which now acts as a formidable support barrier. Looking ahead, the path of least resistance remains upward; a decisive break above the current congestion zone opens the door for a powerful retest of the all-time high region, with a clear target of $4,285 if bullish conviction returns.
The 4H chart shows the intricate battle between buyers and sellers. We can see a clear sideways move formed within a broad channel, bounded by an ascending support line and a descending resistance line. The presence of a swap zone around $4,150 indicates heavy institutional activity, where large positions are being exchanged, often preceding significant moves. The downward-sloping trendline acts as immediate support; a clean rejection would signal the end of consolidation and the start of the next leg up.
Fundamentally, all eyes are on the upcoming FOMC meeting and the Federal Reserve’s next move on the Federal Funds Rate. Any hint of a prolonged “higher for longer” stance could pressure gold short-term, while dovish signals or acknowledgment of cooling inflation may ignite a breakout. Until then, the market is likely to remain range-bound, as participants refrain from aggressive positioning ahead of the Fed’s guidance. The weekly doji candle underscores this indecision, suggesting that volatility is coiling for a post-statement directional move—most likely to the upside if the Fed softens its rhetoric.
If this idea resonates with you or you have your own opinion, traders, hit the comments. I’m excited to read your thoughts!

Price Compressing Below Trendline, Waiting for a Liquidity SweepGold continues to consolidate inside a narrow range as markets wait for fresh USD flows and upcoming Fed expectations. Sellers are losing momentum, but buyers still haven’t secured a clean breakout as price remains capped beneath the short-term descending trendline.
Current structure suggests a classic “liquidity sweep → bullish reversal” setup, with clear liquidity buildup sitting underneath the market.
📊 MMF Technical Outlook (H1)
1️⃣ Price reacting around a previous POC zone (Volume Profile)
Heavy traded area → easy for fake moves
No clean breakout above 4,218 yet
2️⃣ Key Levels – Main Setup Favors “Dip-Buy”
Important zones:
4,218 – 4,220 → Minor supply + descending trendline; breakout needed for bullish continuation
4,190 – 4,181 → Liquidity sweep zone (ideal buy area)
4,242 → Main upside target if breakout confirms
Structure shows price may dip lower first to clear liquidity before reversing upward.
🎯 MMF Daily Plan – BUY After Liquidity Sweep
▶️ Primary Scenario (High-Probability)
Wait for price to sweep liquidity into 4,190 → 4,181.
🔹 BUY Zone: 4,190 – 4,181
🔹 SL: below 4,172
🔹 TP1: 4,218
🔹 TP2: 4,242
Why this works:
Confluence: liquidity pocket + fib retracement + structural demand
MMF Flow suggests a clearing phase before bullish expansion
▶️ Secondary Scenario (Break & Retest)
If price breaks strongly above 4,218, wait for a clean retest to join the trend.
🔹 Entry: 4,218 – 4,220
🔹 TP: 4,242
🧭 MMF Bias Today
Bias: Neutral → Bullish as long as 4,180 holds
Avoid FOMO buys into 4,218 resistance
Only engage after a sweep or a clear BOS + retest

Gold – Potential Choppy Price Action AheadThe market got what it wanted from the Federal Reserve last night when a widely anticipated interest rate cut of 25bps (0.25%) was announced, a move which as a rule is positive for Gold prices as it is an asset that doesn’t bear any interest itself. Initially this was the case, with the popular metal trading from opening levels at 4210 before the Fed decision on Wednesday up to a one week high of 4248 early this morning. However, that is where the positive story ended and Gold prices have since traded back down to 4210 again at the time of writing (0700 GMT).
On a longer-term basis, the drivers underpinning prices still seem to remain in place, namely central bank buying dips, concerns over swelling government debt and an uncertain geopolitical outlook, but in the short-term Gold prices could be at the mercy of general risk sentiment, which is wavering after a disappointing Q3 earnings release from Oracle overnight, and positioning readjustment. This situation isn’t helped by the reality that there is little in the way of scheduled risk events for traders to focus on until the release of US Non-farm Payrolls next Tuesday, December 16th (1330 GMT) and the interest rate decisions from the Bank of England, European Central Bank (December 18th) and Bank of Japan (December 19th).
This backdrop could suggest potential for some choppy price action ahead which may require traders to keep monitoring important support and resistance levels that could impact the direction of Gold moving forward.
Gold Technical Update: Watching the 4245/4265 Resistance Band
Since posting the 4381 October 20th high and 3887 October 28th low, Gold has entered a more balanced phase of sideways trading between these extremes. The over‑extended upside price conditions seen after the recent sharp acceleration higher are currently being unwound by this activity.
This current balance between buyers and sellers is evident in the chart below, but it also highlights that no successful closing breakout has yet materialised in price.
Gold’s initial response to the Fed interest rate cut and subsequent press conference yesterday was more positive, with fresh price strength emerging. However, there is still no evidence of a successful breakout to the topside on a closing basis.
As such, maintaining an awareness of both key support and resistance levels could be important in gauging whether the recent sideways trading range is nearing an end.
Possible Resistance Levels:
As the chart below highlights, there is a combination of potential resistance levels situated just above current price activity. This zone reflects both the downtrend line connecting price highs back to October 20th, which sits at 4245 and the December 1st high at 4265. Having previously marked areas where selling pressure has emerged, traders may now be focused on how this resistance band is defended on a closing basis.
Closing breaks above 4245/4265 could lead to a fresh phase of price strength, marking an upside break in Gold from its sideways activity. While not a guarantee of sustained gains, such a move could open potential to challenge the 4381 October 20th extreme and possibly extend further if that level also gives way on a closing basis.
Potential Support Levels:
For now, the 4245/4265 resistance band remains intact. While this area continues to cap attempts at price strength on a closing basis, risks may shift toward the downside, bringing the Bollinger mid‑average at 4155 into play as a potential support level to monitor.
Closing breaks below this support at 4155, if seen, could suggest scope for continued declines toward 3998, the November 18th low. If this level also gave way, it may open the path toward 3887, the October 28th downside extreme.
The material provided here has not been prepared accordance with legal requirements designed to promote the independence of investment research and as such is considered to be a marketing communication. Whilst it is not subject to any prohibition on dealing ahead of the dissemination of investment research, we will not seek to take any advantage before providing it to our clients.
Pepperstone doesn’t represent that the material provided here is accurate, current or complete, and therefore shouldn’t be relied upon as such. The information, whether from a third party or not, isn’t to be considered as a recommendation; or an offer to buy or sell; or the solicitation of an offer to buy or sell any security, financial product or instrument; or to participate in any particular trading strategy. It does not take into account readers’ financial situation or investment objectives. We advise any readers of this content to seek their own advice. Without the approval of Pepperstone, reproduction or redistribution of this information isn’t permitted.

XAUUSD Long: Demand Holds — Price Aiming for $4,260 RetestHello, traders! The current price action on GOLD (XAUUSD) is developing within a clearly defined ascending channel, showing that the broader bullish structure remains intact despite recent corrective movements. Earlier, the market formed a Double Top pattern near the upper Supply Zone around $4,260, which triggered a bearish reaction and a downside breakout from that distribution phase. After this rejection, price moved into a corrective decline, respecting the Triangle Supply and Demand lines, where multiple breakouts confirmed increasing volatility and active participation from both buyers and sellers. Following the corrective phase, Gold reached a key Pivot Point near the lower Triangle Demand Line, where strong buying interest appeared and initiated a bullish reversal. From this base, price broke back above resistance and entered the current Ascending Channel, forming higher highs and higher lows.
Currently, XAUUSD is consolidating near the $4,190–$4,200 Demand Zone, where buyers are actively defending the structure. The market is holding above channel support, suggesting that bullish momentum is stabilizing after the pullback.
My scenario remains bullish as long as price stays above the highlighted Demand Zone around $4,180–$4,190 and continues to respect the lower boundary of the ascending channel. I expect Gold to gradually build momentum and attempt another move toward the $4,260 Resistance level, which represents the next major target and the top of the recent supply area. A confident breakout above this zone would signal trend continuation and open the door for further upside. However, a failure to hold current demand could trigger a deeper correction back toward the lower channel area. For now, the structure favors buyers, with $4,260 as the main upside objective. Manage your risk!

XAU/USD | Gold Awaits FOMC and Powell to Set the Next Big Move!By analyzing the #Gold chart on the 4 hour timeframe, we can see that price is still moving sideways inside the same range and has not chosen a clear direction yet. Even so, the previous analysis played out and gold dropped about 350 pips before bouncing back to the 4220 supply zone, where it got rejected again. Right now gold is trading around 4197.
Today’s interest rate decision and Powell’s speech will decide the next major trend.
If Powell sounds Hawkish, we could see a heavy drop in gold.
If he sounds Dovish, gold may push toward levels above 4300.
Keep an eye on the demand zones at 4157 to 4169 and 4130 to 4145, and the supply zones at 4225, 4233, and 4241 to 4259. This analysis will be updated soon.
Please support me with your likes and comments to motivate me to share more analysis with you and share your opinion about the possible trend of this chart with me !
Best Regards , Arman Shaban
