SPX500 Formed false breakout Bearish Bias 6,205 SP500 Short-Term Bearish Bias
The SPX500 remains under pressure as it trades below the key resistance level of 6260. Price action suggests a potential rejection from this resistance, signalling a continuation of downside momentum.
This bearish sentiment is further fuelled by recent tariff escalati
About S&P 500 Index
Standard & Poor’s 500 is an American stock market index consisting of 500 large companies having common stock listed on the NYSE or NASDAQ and their market capitalizations. It captures approximately 80% coverage of available market capitalization. Because it includes both growth stocks and value stocks it is one of the most followed equity indices and is considered to be one of the best representations of the U.S. stock market and a trend indicator for the U.S. economy. S&P introduced its first index in 1923 and its present day form on March 4,1957. It was developed and continues to maintained by S&P Dow Jones Indices, a joint venture majority owned by McGraw Hill Financial.

Why Traders Freeze: The Psychology Behind Not Cutting LossesFirst up: let’s address the elephant in the room. Loss aversion — that great human flaw. From the moment your ancient ancestor decided to poke a saber-toothed tiger to see what happens, the brain has been hard-coded to avoid pain at all costs.
Loss aversion is literally in your DNA — studies show

S&P500 (CASh500) Short - double top 15minEntry = 6303.4
SL = 6312.8
Take profit level 1 = 6280.7
Take profit level 2 = 6271.6
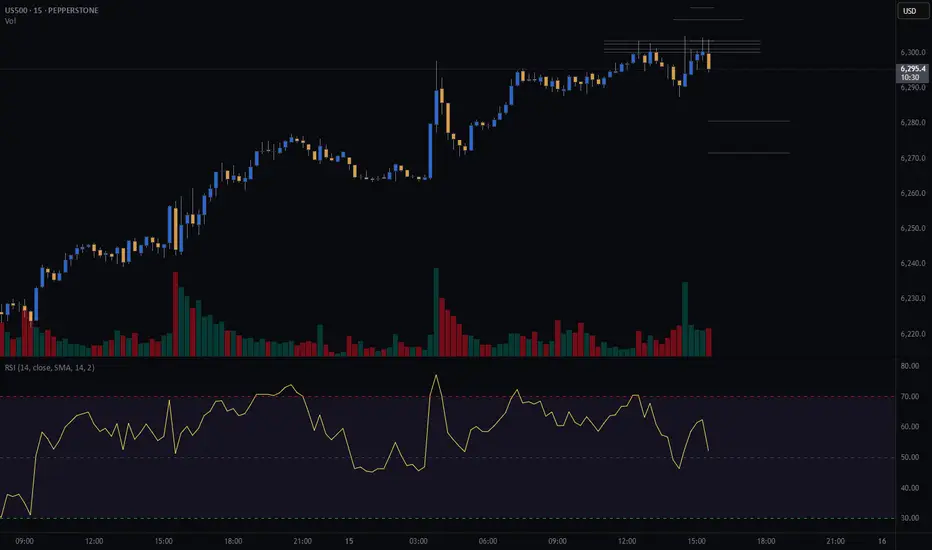
SPX500 Bearish Below 6246 – Eyes 6223 and 6195SPX500 Analysis
SPX500 stays under bearish pressure below 6246, targeting 6223 and possibly 6195 if the decline continues.
Recent tariff escalation by President Trump is adding weight to downside momentum across indices.
Pivot: 6246
Support: 6223, 6195, 6143
Resistance: 6268, 6291

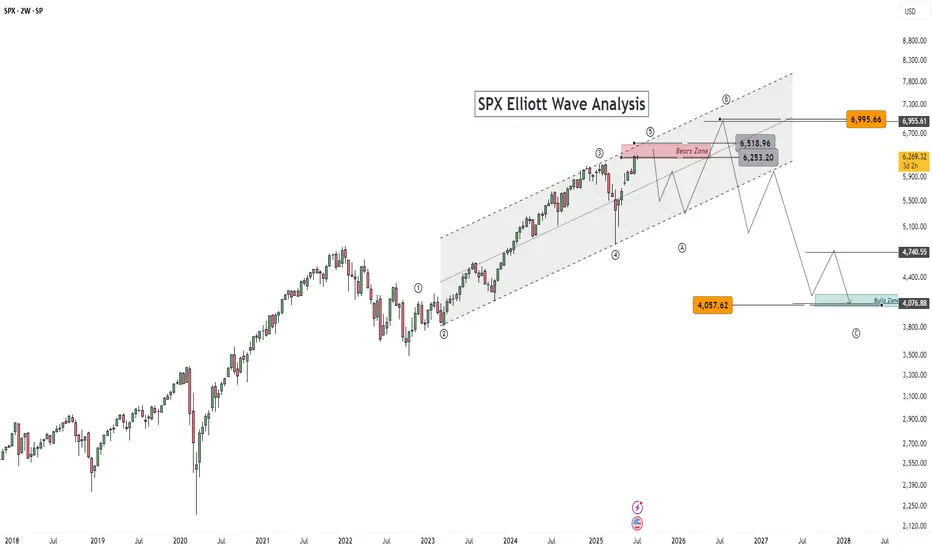
S&P 500 and the Elliott Wave TheoryThis is a continuation of a Weekly chart that I had previously posted. Our Wave 2(Red) was a Zigzag and the expectation is a Flat for Wave 4(Red) which we see occurred. Since Wave 4(Red) completed, a Wave 5(Red) was triggered. We can expect our Wave 5 to express itself in 5 Waves just like any other

S&P500 Accumulation almost over. New rally begins.The S&P500 index (SPX) has been trading within a 3-month Channel Up pattern, within which, it's been replicating almost the same structure. This involves an aggressive Bullish Leg Phase (dotted Channel Up), followed by a correction/ Accumulation Phase (blue Channels), which eventually leads to the n

This is just my Elliott Wave Analysis not financial Advice. $SPThis is just my Elliott Wave Analysis not financial Advice. SP:SPX #SPX SP:SPX
20% in 60 daysSince the 90's we have seen many times where the broader market (SPX) has seen a pretty significant pull back, more than 10% and then a rally. Almost every time the market rose more than 20% in 60 days or less has been a good place to take profits. Clearly everything is super bullish right now, and

IS THE STOCK MARKET HEADING INTO DOT COM BUBBLE 2.0?In this video we look at the 3 month chart of SP:SPX using the traders dynamic index & Fibonacci retracement levels to put together a bullish case for the overall stock market to go on a monster rally over the next 7 years
We also theorize about how over the next 2 years the SP:SPX can indeed h

06/30 Weekly Gamma Exposure Outlook🧠 SPX Weekly Outlook — Gamma Breakout + Short Week Setup
The bulls finally broke through after weeks of painful grinding — and they did so with force.
📈 Thursday & Friday brought a textbook gamma squeeze as SPX sliced through the long-standing 6100 call wall , triggering sharp upside accelera

See all ideas
Displays a symbol's price movements over previous years to identify recurring trends.
Frequently Asked Questions
S&P 500 Index reached its highest quote on Jul 10, 2025 — 6,296.30 USD. See more data on the S&P 500 Index chart.
The lowest ever quote of S&P 500 Index is 1,416.30 USD. It was reached on Dec 13, 2012. See more data on the S&P 500 Index chart.
S&P 500 Index is just a number that lets you track performance of the instruments comprising the index, so you can't invest in it directly. But you can buy S&P 500 Index futures or funds or invest in its components.