SPX Update📊 SPX Update
SPX is retracing now 🔄
If the price keeps retracing to the green zone level 🟢, there’s potential to enter a long position with confirmation ✅
This area is where buyers previously accumulated and could push the price up again 📈
Related pairs

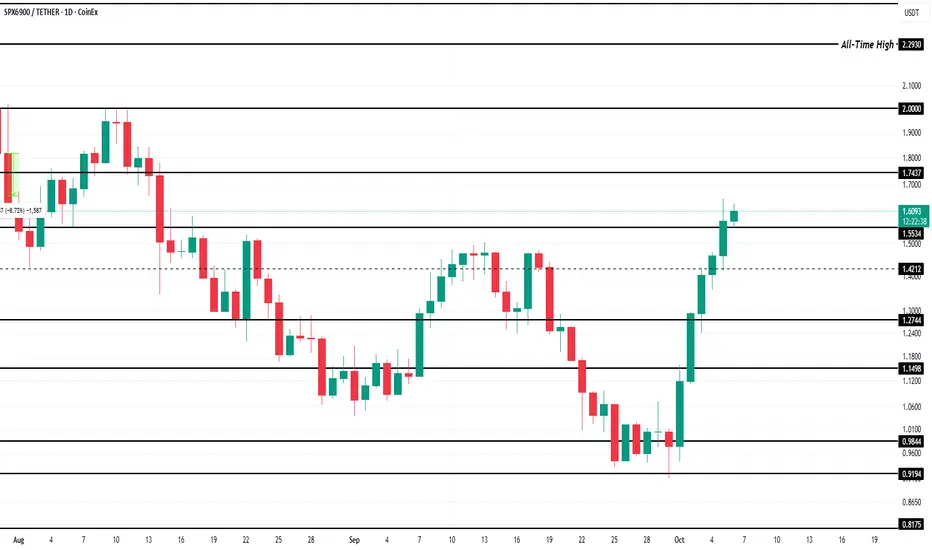
3 Altcoins To Watch In The Second Week Of October 2025SPX is trading at $1.62, maintaining its position above the crucial $1.58 support level. The altcoin has surged nearly 62% over the past week, hitting a two-month high. This sharp rally reflects renewed investor interest.
Currently, SPX is about 41% away from retesting its all-time high of $2.29, a
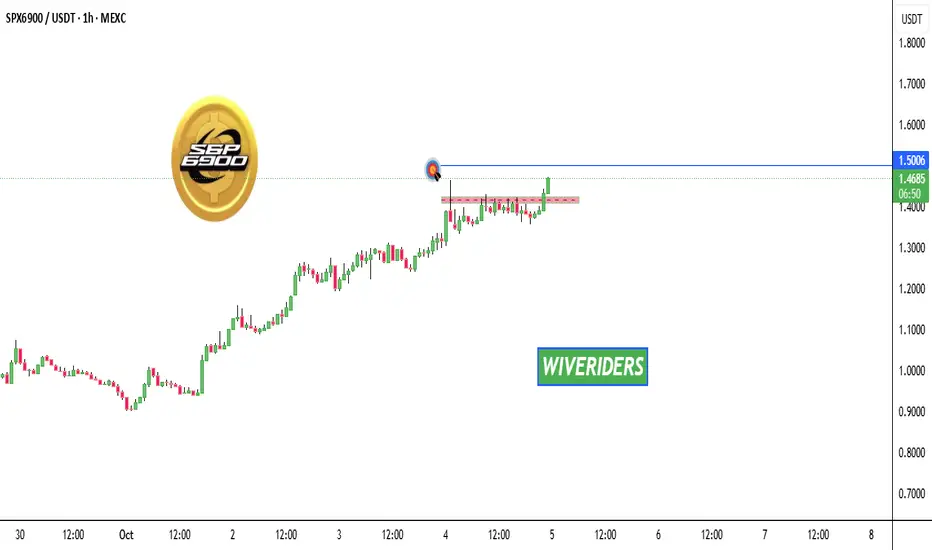
SPX Update📊 SPX Update
SPX has broken out of the red resistance zone ✅
and is now approaching the first target — blue line level 🎯
Momentum looks strong — watch for continuation or possible pullback at target zone ⚡
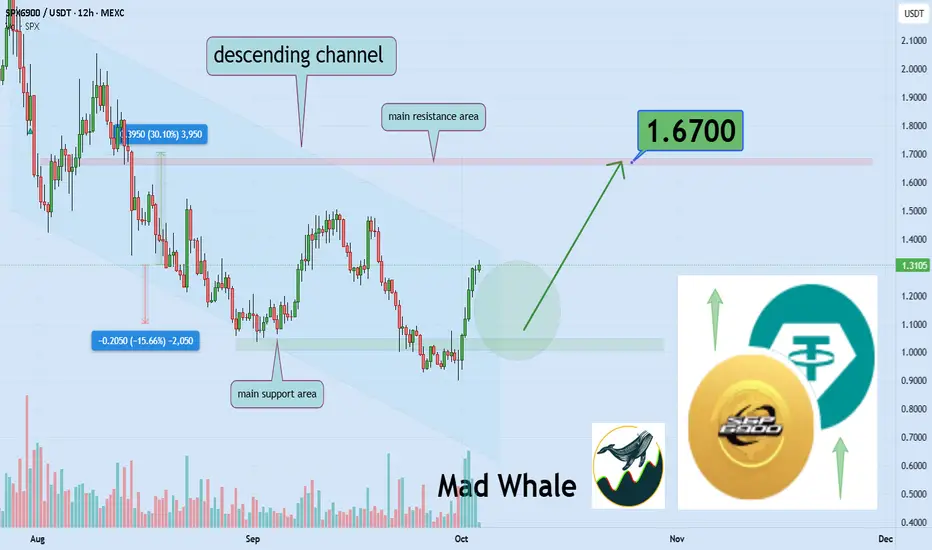
Descending Channel Test: SPX900 Could Rally 30% to $1.67Hello✌️
Let’s analyze SPX900’s price action both technically and fundamentally 📈.
🔍Fundamental analysis:
SPX6900 pumps when social buzz goes up, but can also drop fast if hype cools down.
📊Technical analysis:
MEXC:SPXUSDT is trading within a descending channel and approaching a key sup
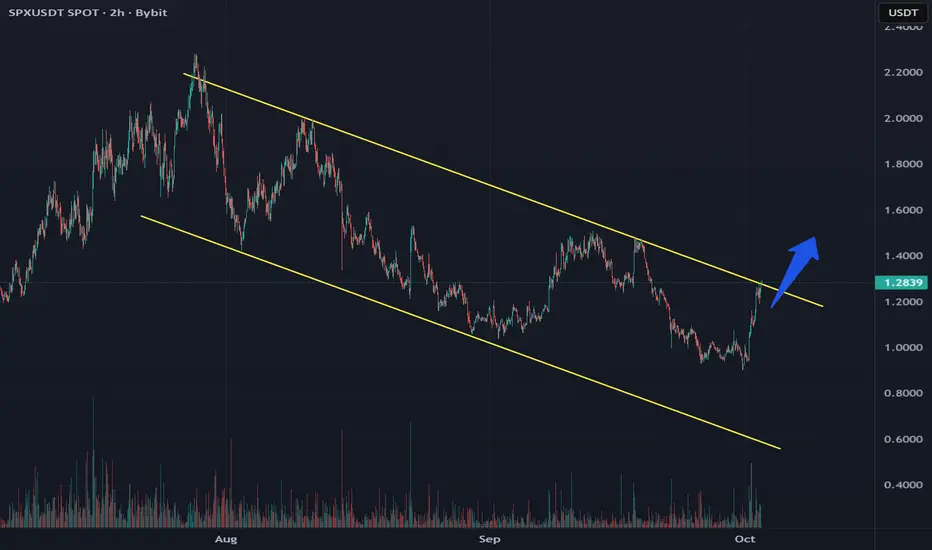
SPX Analysis on Global Timeframe Shows Bullish FlagThe SPX is moving within the boundaries of a bullish flag on the global timeframe
The price is attempting to break through the upper boundary of the pattern. If the price breaks through, the pattern predicts an upward price movement
Current price: $1.2429
If the price breaks through, the pattern
SPX6900 Targeting $3.89We just competed a really nice test of the 50% and 61.8% retrace right on the trendline. I could be just up from here to the ultimate target at the top trendline at around $3.89

SPX Market Update📊 SPX Market Update
SPX is testing the blue support level 🔵
⚠️ If it breaks down, this could confirm further downside momentum 📉
⚡ Stay alert and wait for confirmation before entering any trade.

SPX BUY MARKETHello friends
Given the decline we had, the price was well supported in the support range and broke its resistance with a strong wedge, showing that buyers entered and it can move to the specified targets.
Observe risk and capital management.
*Trade safely with us*

SPX Breakout Alert!🚨 SPX Breakout Alert! 🚨
SP:SPX is currently testing the red resistance zone 🔴
If price breaks out, the first target will be the green line level 🎯
A confirmed breakout here would signal bullish continuation and could drive further upside ✅

Parabolic SAR Signals Bearish Pressure on SPXSPX is facing notable bearish pressure as the Parabolic Stop and Reverse (SAR) currently forms dynamic resistance above its price at $1.93. This positioning suggests that sellers remain in control and the market could continue to lean downward in the short term.
The Parabolic SAR helps traders iden

See all ideas
Summarizing what the indicators are suggesting.
Oscillators
Neutral
SellBuy
Strong sellStrong buy
Strong sellSellNeutralBuyStrong buy
Oscillators
Neutral
SellBuy
Strong sellStrong buy
Strong sellSellNeutralBuyStrong buy
Summary
Neutral
SellBuy
Strong sellStrong buy
Strong sellSellNeutralBuyStrong buy
Summary
Neutral
SellBuy
Strong sellStrong buy
Strong sellSellNeutralBuyStrong buy
Summary
Neutral
SellBuy
Strong sellStrong buy
Strong sellSellNeutralBuyStrong buy
Moving Averages
Neutral
SellBuy
Strong sellStrong buy
Strong sellSellNeutralBuyStrong buy
Moving Averages
Neutral
SellBuy
Strong sellStrong buy
Strong sellSellNeutralBuyStrong buy
Displays a symbol's price movements over previous years to identify recurring trends.
Frequently Asked Questions
The current price of SPX3xLong/Tether (SPX) is 2.71837 USDT — it has risen 104.17 K% in the past 24 hours. Try placing this info into the context by checking out what coins are also gaining and losing at the moment and seeing SPX price chart.
SPX3xLong/Tether price has risen by 45.34 K% over the last week, its month performance shows a 16.12 K% increase, and as for the last year, SPX3xLong/Tether has increased by 171.88%. See more dynamics on SPX price chart.
Keep track of coins' changes with our Crypto Coins Heatmap.
Keep track of coins' changes with our Crypto Coins Heatmap.
The safest choice when buying SPX is to go to a well-known crypto exchange. Some of the popular names are Binance, Coinbase, Kraken. But you'll have to find a reliable broker and create an account first. You can trade SPX right from TradingView charts — just choose a broker and connect to your account.
SPX3xLong/Tether (SPX) is just as reliable as any other crypto asset — this corner of the world market is highly volatile. Today, for instance, SPX3xLong/Tether is estimated as 118.98 K% volatile. The only thing it means is that you must prepare and examine all available information before making a decision. And if you're not sure about SPX3xLong/Tether, you can find more inspiration in our curated watchlists.
You can discuss SPX3xLong/Tether (SPX) with other users in our public chats, Minds or in the comments to Ideas.