SPX$4.2 is the target for $SPX. We collectively entered at the bottom and we are holding to $4.2 because we believe in something. The structure is clean, momentum is building, and the trend is on our side.

SPX Analysis (12H)As shown on the chart, the SPX structure is bearish because we have bearish CH (Change of Character) and BOS (Break of Structure).
Based on the fractals indicated with dashed lines and the drawn rectangles, we should expect one more bearish leg in this timeframe.
We are looking for sell/short posi

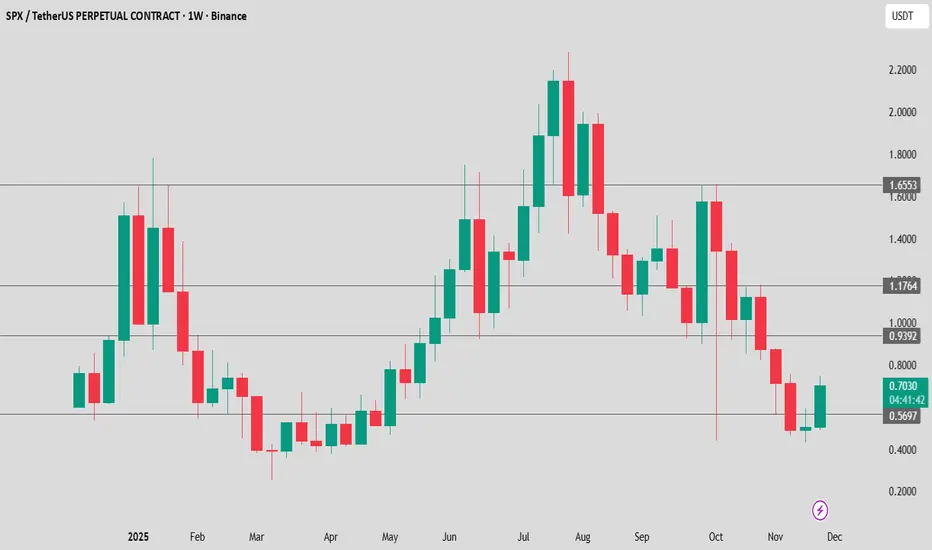
SPXSPX is in a broad downtrend after a full bull cycle.
The recent green candle indicates a temporary bounce, not a confirmed reversal.
Key resistance: 1.00 USDT
Key support: 0.5697 USDT
A break above 1.00 would be the first real bullish confirmation.
SPX Update🚨📊 SPX Update
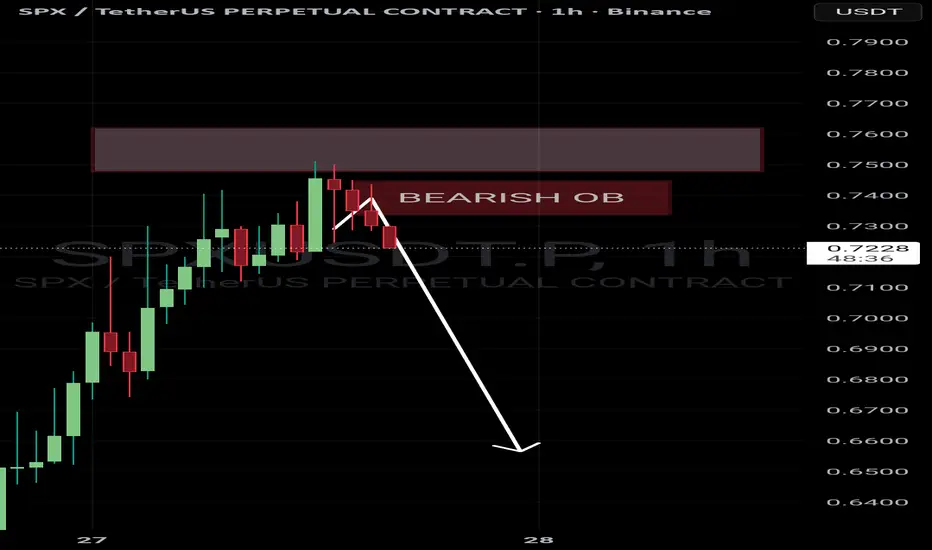
SPX has also formed a new resistance zone in red 🔴.
This level is now acting as a strong ceiling,
and price must break out above this red resistance
to show any real bullish momentum again.
Until that breakout happens,
sellers remain in control and upside stays limited.

SPX SHORT IDEA
↳Shorting SPX6900 here, not sure why this shitcoin is so strong
Note: not a lot of liquidity/volume on Hyperliquid, Binance futures better, if you trade other exchanges check liquidity.
SPX Update🚨📊 SPX Update
SPX is testing the red resistance zone right now 🔴.
If price manages to break out above this red level,
the first target will be the green line zone 🟢 —
the next key level on the chart.

SPXYou can clearly see what is happening with $SPX. It has bottomed. We had downtrend, uptrend, downtrend, and now it is time for the next uptrend. The structure points straight toward a move to $4 plus. Momentum is shifting and the rotation is lining up.

SPX Forms Global Double-Bottom PatternThe SPX has formed a global W pattern, or double bottom , and is currently in the final phase of the formation, which is likely to reach the liquidation zone highlighted in purple.
Current price: $0.6333
If the price breaks the level where the previous peak bottomed, the ascending structure i

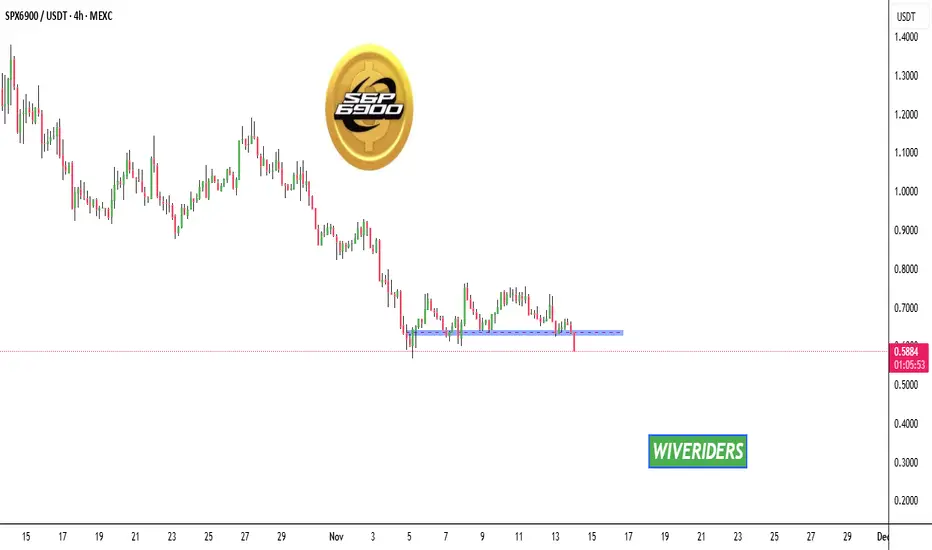
SPX Update📊 SPX Update
SP:SPX has broken below the blue support level 🔵
As long as it doesn’t move back above this level, it remains bearish 🔻
Structure shows continued weakness — watch for the next support zone.
SPX Update📊 SPX Update
SPX is retracing now 🔄
If the price keeps retracing to the green zone level 🟢, there’s potential to enter a long position with confirmation ✅
This area is where buyers previously accumulated and could push the price up again 📈

See all ideas
Summarizing what the indicators are suggesting.
Oscillators
Neutral
SellBuy
Strong sellStrong buy
Strong sellSellNeutralBuyStrong buy
Oscillators
Neutral
SellBuy
Strong sellStrong buy
Strong sellSellNeutralBuyStrong buy
Summary
Neutral
SellBuy
Strong sellStrong buy
Strong sellSellNeutralBuyStrong buy
Summary
Neutral
SellBuy
Strong sellStrong buy
Strong sellSellNeutralBuyStrong buy
Summary
Neutral
SellBuy
Strong sellStrong buy
Strong sellSellNeutralBuyStrong buy
Moving Averages
Neutral
SellBuy
Strong sellStrong buy
Strong sellSellNeutralBuyStrong buy
Moving Averages
Neutral
SellBuy
Strong sellStrong buy
Strong sellSellNeutralBuyStrong buy
Displays a symbol's price movements over previous years to identify recurring trends.