SPX$4.2 is the target for $SPX. We collectively entered at the bottom and we are holding to $4.2 because we believe in something. The structure is clean, momentum is building, and the trend is on our side.
Market insights

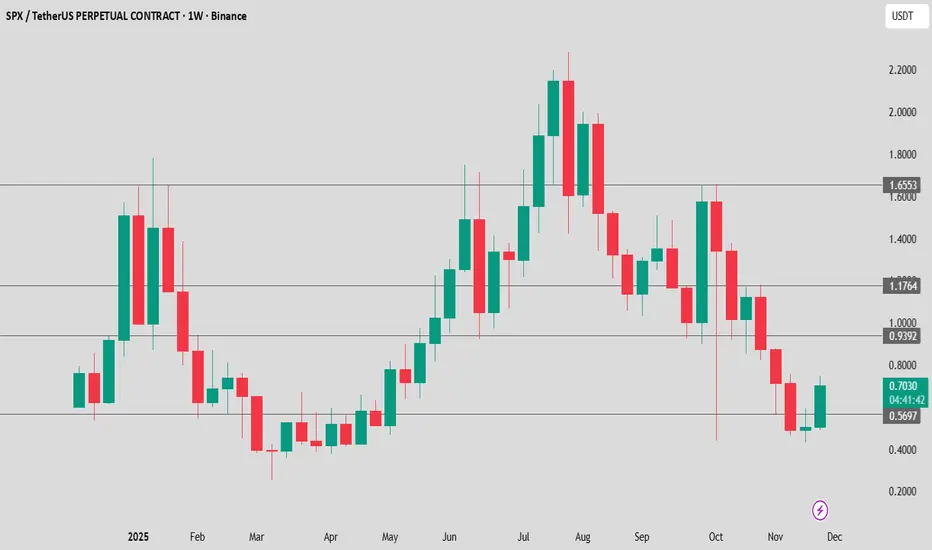
SPXSPX is in a broad downtrend after a full bull cycle.
The recent green candle indicates a temporary bounce, not a confirmed reversal.
Key resistance: 1.00 USDT
Key support: 0.5697 USDT
A break above 1.00 would be the first real bullish confirmation.
SPX Analysis (12H)As shown on the chart, the SPX structure is bearish because we have bearish CH (Change of Character) and BOS (Break of Structure).
Based on the fractals indicated with dashed lines and the drawn rectangles, we should expect one more bearish leg in this timeframe.
We are looking for sell/short positions around the swap zone.
The targets have been marked on the chart.
A daily candle closing above the invalidation level will invalidate this analysis.
Do not enter the position without capital management and stop setting
Comment if you have any questions
thank you

SPX Update🚨📊 SPX Update
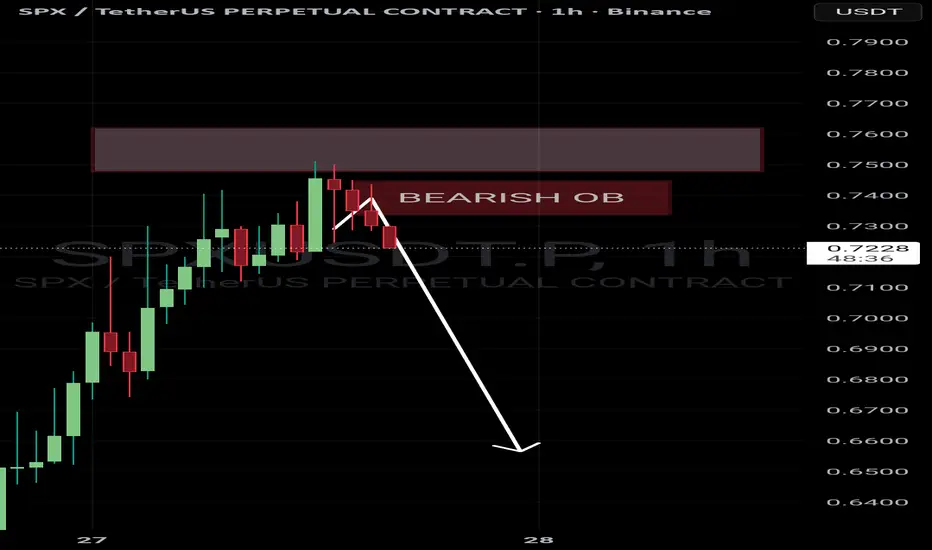
SPX has also formed a new resistance zone in red 🔴.
This level is now acting as a strong ceiling,
and price must break out above this red resistance
to show any real bullish momentum again.
Until that breakout happens,
sellers remain in control and upside stays limited.

SPX SHORT IDEA
↳Shorting SPX6900 here, not sure why this shitcoin is so strong
Note: not a lot of liquidity/volume on Hyperliquid, Binance futures better, if you trade other exchanges check liquidity.
SPX Update🚨📊 SPX Update
SPX is testing the red resistance zone right now 🔴.
If price manages to break out above this red level,
the first target will be the green line zone 🟢 —
the next key level on the chart.

SPXYou can clearly see what is happening with $SPX. It has bottomed. We had downtrend, uptrend, downtrend, and now it is time for the next uptrend. The structure points straight toward a move to $4 plus. Momentum is shifting and the rotation is lining up.

SPX Forms Global Double-Bottom PatternThe SPX has formed a global W pattern, or double bottom , and is currently in the final phase of the formation, which is likely to reach the liquidation zone highlighted in purple.
Current price: $0.6333
If the price breaks the level where the previous peak bottomed, the ascending structure is more likely to be broken, and the movement may continue downward.
Full breakdown on website

SPX Update📊 SPX Update
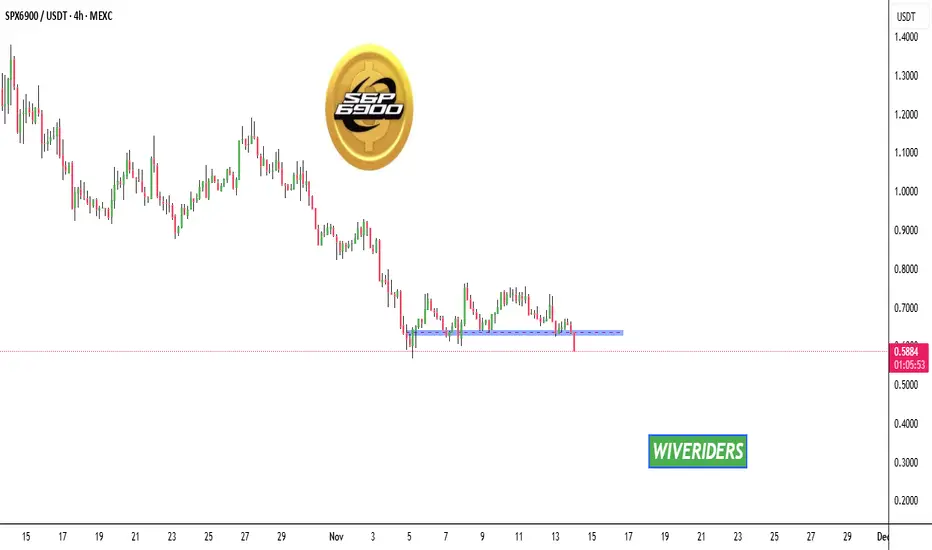
SP:SPX has broken below the blue support level 🔵
As long as it doesn’t move back above this level, it remains bearish 🔻
Structure shows continued weakness — watch for the next support zone.
SPX Update📊 SPX Update
SPX is retracing now 🔄
If the price keeps retracing to the green zone level 🟢, there’s potential to enter a long position with confirmation ✅
This area is where buyers previously accumulated and could push the price up again 📈

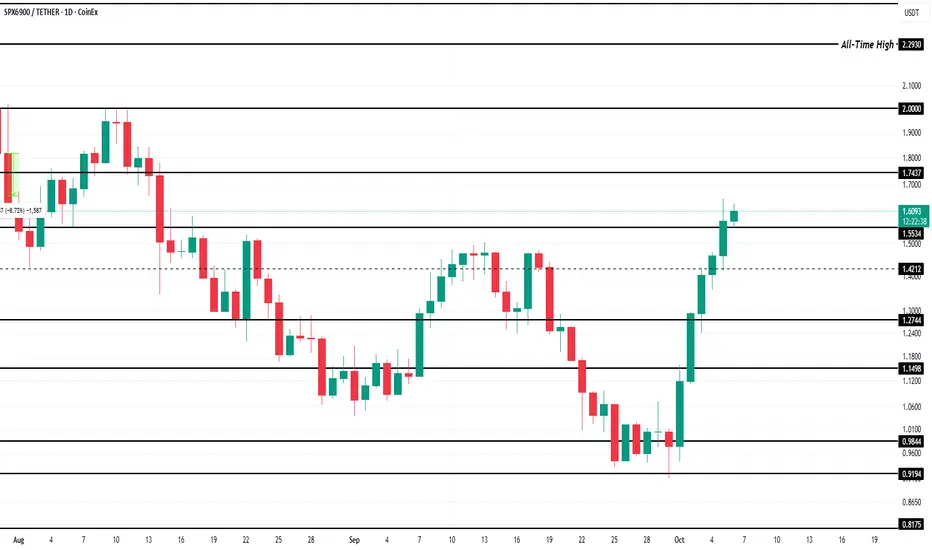
3 Altcoins To Watch In The Second Week Of October 2025SPX is trading at $1.62, maintaining its position above the crucial $1.58 support level. The altcoin has surged nearly 62% over the past week, hitting a two-month high. This sharp rally reflects renewed investor interest.
Currently, SPX is about 41% away from retesting its all-time high of $2.29, achieved in late July. Technical indicators, particularly the exponential moving averages (EMAs), highlight sustained bullish momentum. If this strength continues, SPX could break through the $1.74 resistance level and potentially climb toward $2.00 in the coming sessions.
However, market sentiment remains crucial to sustaining this rally. Should investors begin taking profits, SPX could fall below the $1.58 support. A deeper correction might push the price down to $1.39 or lower, undermining bullish momentum and signaling a temporary reversal in the altcoin’s upward trend.
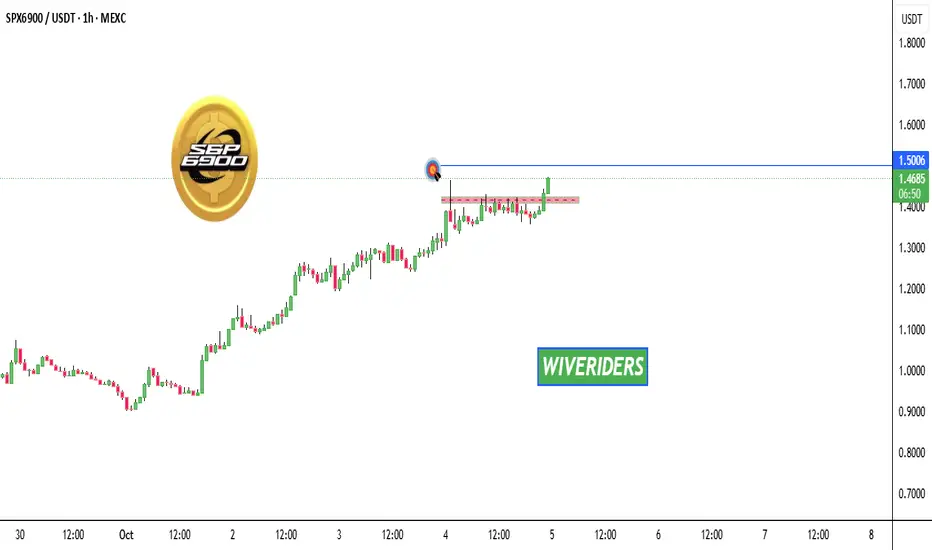
SPX Update📊 SPX Update
SPX has broken out of the red resistance zone ✅
and is now approaching the first target — blue line level 🎯
Momentum looks strong — watch for continuation or possible pullback at target zone ⚡
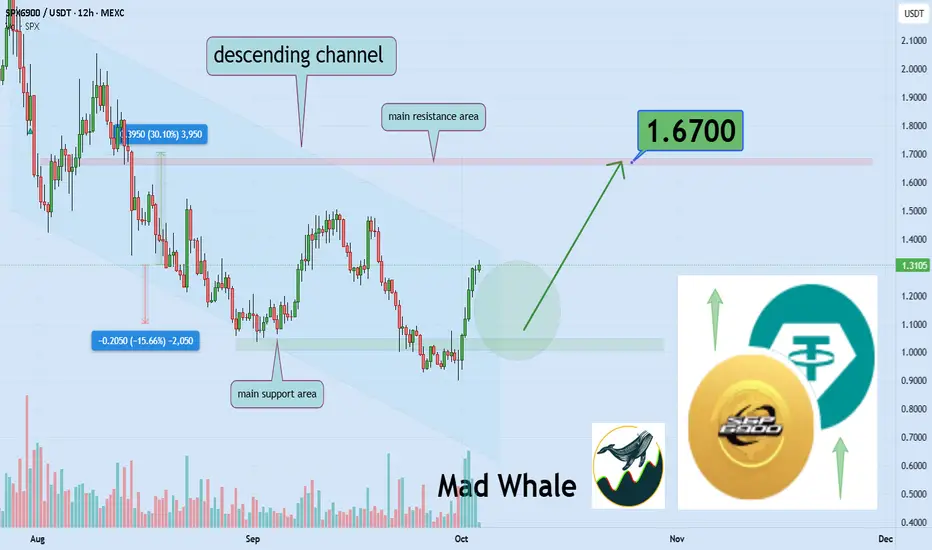
Descending Channel Test: SPX900 Could Rally 30% to $1.67Hello✌️
Let’s analyze SPX900’s price action both technically and fundamentally 📈.
🔍Fundamental analysis:
SPX6900 pumps when social buzz goes up, but can also drop fast if hype cools down.
📊Technical analysis:
MEXC:SPXUSDT is trading within a descending channel and approaching a key support and the upper boundary. A breakout above the channel could drive a potential 30% upside toward $1.67.⚡
📈Using My Analysis to Open Your Position:
You can use my fundamental and technical insights along with the chart. The red and green arrows on the left help you set entry, take-profit, and stop-loss levels, serving as clear signals for your trades.⚡️ Also, please review the TradingView disclaimer carefully.🛡
✨We put love into every post!
Your support inspires us 💛 Drop a comment we’d love to hear from you! Thanks, Mad Whale
SPX Analysis on Global Timeframe Shows Bullish FlagThe SPX is moving within the boundaries of a bullish flag on the global timeframe
The price is attempting to break through the upper boundary of the pattern. If the price breaks through, the pattern predicts an upward price movement
Current price: $1.2429
If the price breaks through, the pattern predicts a price move to $1.3740 and above
Also, if the price fails to hold after breaking through the upper boundary, a downward rebound to 1.0118 and below is possible
More detailed analysis, additional charts, and key levels to watch are available on our site
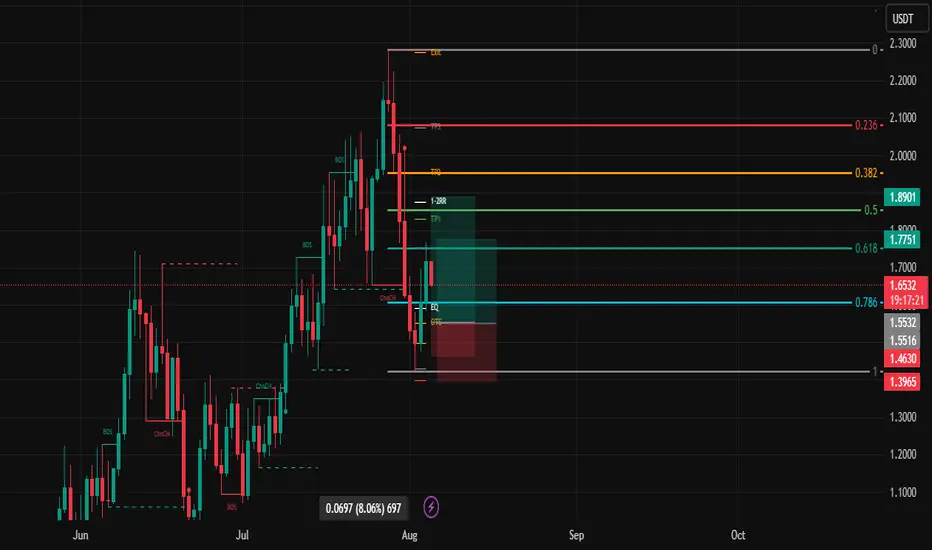
SPX6900 Targeting $3.89We just competed a really nice test of the 50% and 61.8% retrace right on the trendline. I could be just up from here to the ultimate target at the top trendline at around $3.89

SPX Market Update📊 SPX Market Update
SPX is testing the blue support level 🔵
⚠️ If it breaks down, this could confirm further downside momentum 📉
⚡ Stay alert and wait for confirmation before entering any trade.

SPX BUY MARKETHello friends
Given the decline we had, the price was well supported in the support range and broke its resistance with a strong wedge, showing that buyers entered and it can move to the specified targets.
Observe risk and capital management.
*Trade safely with us*

SPX Breakout Alert!🚨 SPX Breakout Alert! 🚨
SP:SPX is currently testing the red resistance zone 🔴
If price breaks out, the first target will be the green line level 🎯
A confirmed breakout here would signal bullish continuation and could drive further upside ✅

Parabolic SAR Signals Bearish Pressure on SPXSPX is facing notable bearish pressure as the Parabolic Stop and Reverse (SAR) currently forms dynamic resistance above its price at $1.93. This positioning suggests that sellers remain in control and the market could continue to lean downward in the short term.
The Parabolic SAR helps traders identify an asset’s trend direction and possible reversals. When its dots appear below the price, it reflects bullish momentum, signaling that buyers are driving the market higher.
Conversely, when the dots shift above the price, it implies mounting selling pressure, often interpreted as a continuation signal for bearish moves.

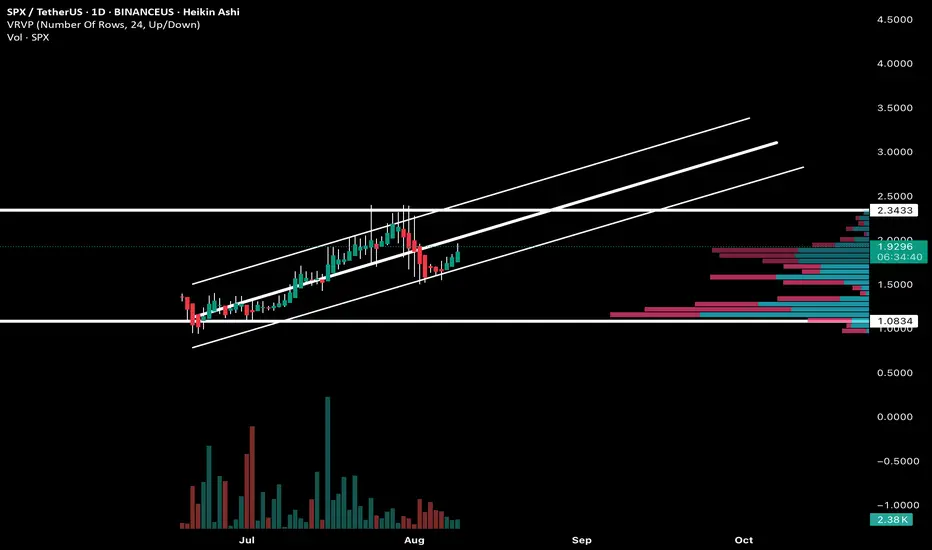
SPX USDT Daily Outlook (August 9, 2025)SPX-----
Structure Detected
Price is in a rising parallel channel with multiple touches on both upper and lower trendlines — a sustained bullish structure since the left side of the chart.
Recently, price pulled back to the lower channel boundary and is now bouncing upward.
There’s a horizontal resistance around 2.3433 and a major support base near 1.08.
Volume profile (VRVP) shows high-volume node around the current price (1.93), meaning this area has been heavily traded — often a pivot zone.
The recent candles show consecutive green Heikin Ashi candles, indicating current bullish momentum after the correction.
Market Bias
Short-term: Bullish (rebound from lower channel, green candles, reclaim attempt of mid-channel).
Medium-term: Still bullish while inside the ascending channel, but caution near the 2.34 resistance as it’s been a rejection zone before.
Bullish Targets
2.00 – 2.05 → reclaim and hold to confirm momentum.
2.34 (major resistance and top of volume profile) — key breakout point.
If 2.34 breaks with conviction, upside targets move toward ~2.80 – 3.00 (upper channel).
Bearish Levels / Invalidation
First warning if price closes back below ~1.75 (loses mid-channel support).
Strong breakdown confirmation if 1.50 fails (mid-volume node).
Full structure breakdown below 1.0834 — would invalidate the bullish channel.
🕰️ Timeframe-Based Targets
Daily Swing Targets:
Upside: 2.00 → 2.34 → 2.80
Downside: 1.75 → 1.50 → 1.083
Summary:
SPXUSDT is still in a broader uptrend channel and is currently bouncing from the lower boundary. The immediate battle is reclaiming the 1.93–2.00 zone to set up a run toward 2.34. A rejection there could send price back toward 1.75–1.50, but until the lower channel breaks, the structure remains bullish.
Long SPXSPX looking interesting to me but I have already put a limit on Pengu. A pair I have been watching since yesterday, Looking for an entry on a retracement. Similar structure as SPX, to avoid over exposure, Let me paper trade SPX
SPX6900 Bulls Eyeing 33% Surge Toward Explosive $2.60 TargetHello✌
Let’s analyze SPX6900’s upcoming price potential 📈.
MEXC:SPXUSDT has maintained strong bullish momentum in recent weeks, supported by a stream of positive fundamentals 📈. The price is currently holding within an ascending channel and resting near daily support. If this level holds, a 33% upside toward the $2.60 target could follow 🚀
✨We put love into every post!
Your support inspires us 💛 Drop a comment we’d love to hear from you! Thanks , Mad Whale

SPXUSDT 1D#SPX has broken above the Cup and Handle pattern, and based on the RSI, there's a high probability it may retest the neckline once again, which now serves as a support zone.
📌 In case of a bounce from this level, the potential upside targets are:
🎯 $2.3693
🎯 $2.7724
🎯 $2.9829
🎯 $3.2852
🎯 $3.8514
⚠️ As always, use a tight stop-loss and apply proper risk management.
