About SPY
SPY Fund Summary
The investment seeks to provide investment results that, before expenses, generally correspond to the price and yield performance of the S&P 500 Index. The Trust seeks to achieve its investment objective by holding a portfolio of the common stocks that are included in the Index), with the weight of each stock in the Portfolio substantially corresponding to the weight of such stock in the Index.
The investment seeks to provide investment results that, before expenses, generally correspond to the price and yield performance of the S&P 500 Index. The Trust seeks to achieve its investment objective by holding a portfolio of the common stocks that are included in the Index), with the weight of each stock in the Portfolio substantially corresponding to the weight of such stock in the Index.
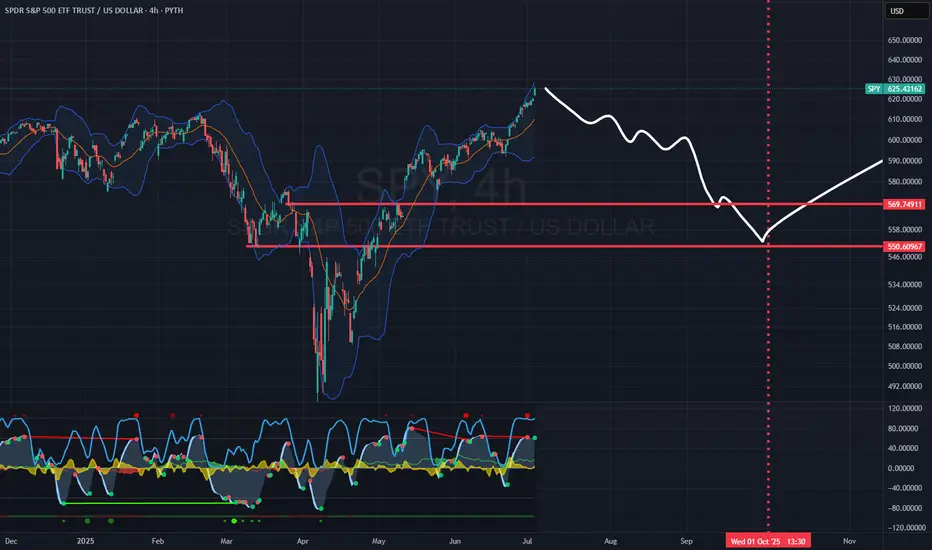
$SPY Market Outlook - Sluggish & Uncertain
AMEX:SPY is showing a sluggish pattern, resembling the 01/20–02/20 period, with "low" predictability —anything could happen! We might see NASDAQ:TLT weakness or, conversely, a wave of solid trade deals pushing prices higher. From a risk-reward perspective, it’s prudent to stay light or hedge.

SPY SPX Final low in June around 474Fork projection for SPY Final low in June around 474
May the Fork be with you!
NotTradingAdvice
YourOwnRisk
ResearchFractals
PitchForkTA
TheRoaring2020s
btc eth Crypto
@X3EM on BlueSky

SPY 1d Chart, March 2025Sharing what I am expecting from AMEX:SPY over the next few weeks. After this selloff, I am expecting somewhat of a bounce, before we can re-assess around the 592-598 region.
I only expect this if we can avoid any additional crazy tariff news in the next few days. The area in red will be very t

THE ONLY BULLISH WAVE COUNT !!! 582 SPY support The chart posted is what I can say Is the ONLY bullish wave count . We should was the .382 support in SPY and this also makes wave 4 and 2 equal .We did Top into the spiral 6 in total due 11/29/12/5 Turn this was the TOP TICK in NYA DJI XLU IYT DJT . There is clear LONG TERM DAMAGE in the NYA

SPY does a rising wedge suggest a reversal? SHORTSPY on a 30 minute chart shows a rising wedge over the past week. Price is now under a nearly
flat upper trendline of resistance while the support trendline is rising. The dual TF RSI
indicator shows strength about 70 while the zero lag MACD shows a K /D line cross.
Because of this I believe,


"SPY Peaks: Signs Point to Market Reaching Pinnacle"SPY ETF Approaching Critical Resistance Amid Bearish Signals
The SPDR S&P 500 ETF Trust (SPY) has been a focal point for investors seeking exposure to the broader equity market. However, recent indicators suggest a potential shift in sentiment as the ETF nears significant resistance levels, hintin

Retracement in market movementsI've noticed a rejection occurring at the 465.00 level, followed by a retest at 463.00, aligning with yesterday's closing price. This suggests that the day will conclude with the establishment of a trading range, potentially paving the way for selling opportunities leading into the weekend for (SPY)

See all ideas
Displays a symbol's price movements over previous years to identify recurring trends.