SPY trade ideas
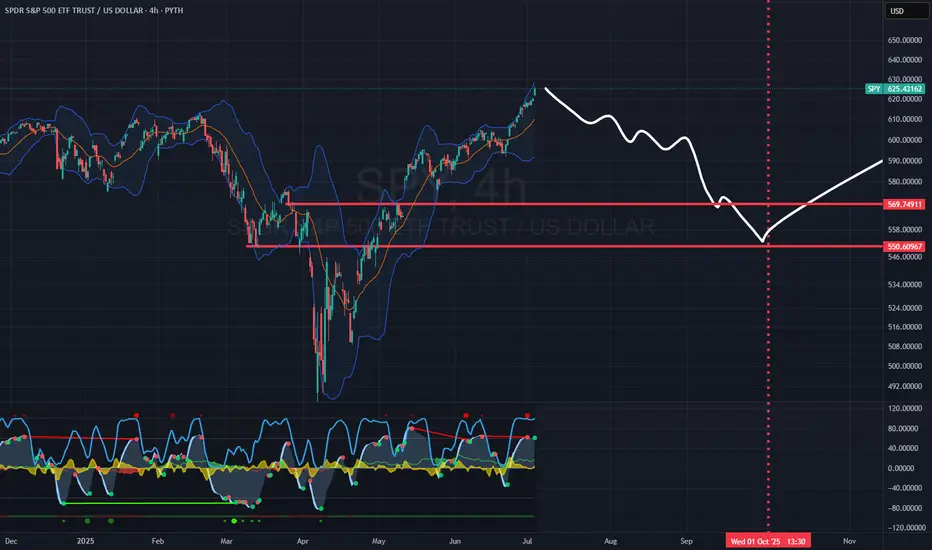
$SPY Market Outlook - Sluggish & Uncertain
AMEX:SPY is showing a sluggish pattern, resembling the 01/20–02/20 period, with "low" predictability —anything could happen! We might see NASDAQ:TLT weakness or, conversely, a wave of solid trade deals pushing prices higher. From a risk-reward perspective, it’s prudent to stay light or hedge. Technically, horizontal resistance is at $577.00, with support likely to test the upsloping trendline as of today at $538.00

SPY SPX Final low in June around 474Fork projection for SPY Final low in June around 474
May the Fork be with you!
NotTradingAdvice
YourOwnRisk
ResearchFractals
PitchForkTA
TheRoaring2020s
btc eth Crypto
@X3EM on BlueSky

SPY 1d Chart, March 2025Sharing what I am expecting from AMEX:SPY over the next few weeks. After this selloff, I am expecting somewhat of a bounce, before we can re-assess around the 592-598 region.
I only expect this if we can avoid any additional crazy tariff news in the next few days. The area in red will be very telling.

THE ONLY BULLISH WAVE COUNT !!! 582 SPY support The chart posted is what I can say Is the ONLY bullish wave count . We should was the .382 support in SPY and this also makes wave 4 and 2 equal .We did Top into the spiral 6 in total due 11/29/12/5 Turn this was the TOP TICK in NYA DJI XLU IYT DJT . There is clear LONG TERM DAMAGE in the NYA and all the indexes listed . The FED is clear BEHIND and LIED today as to UNEMPLOYMENT as in 2025 DOGE will cause this to rise as per my forecast of 5.5 in 2025

SPY does a rising wedge suggest a reversal? SHORTSPY on a 30 minute chart shows a rising wedge over the past week. Price is now under a nearly
flat upper trendline of resistance while the support trendline is rising. The dual TF RSI
indicator shows strength about 70 while the zero lag MACD shows a K /D line cross.
Because of this I believe, SPY may retrace to 468 or the level of the Fib 0.5. Since SPY is a high
volume high liquidity slow spread instrument I see a buying a put option or s short swing trade
short on the shares as strong consideration for the next trading day if the breakdown is
confirmed.


"SPY Peaks: Signs Point to Market Reaching Pinnacle"SPY ETF Approaching Critical Resistance Amid Bearish Signals
The SPDR S&P 500 ETF Trust (SPY) has been a focal point for investors seeking exposure to the broader equity market. However, recent indicators suggest a potential shift in sentiment as the ETF nears significant resistance levels, hinting at a looming bearish turn.
As of late, SPY has been on a notable uptrend, consistently climbing towards one-year high resistance levels. This trajectory has garnered attention from investors eyeing the possibility of continued gains. Yet, caution flags are waving as the ETF approaches the $500 to $520 range, projected to materialize by March or April of 2024.
Market analysts and technicians are closely monitoring this critical juncture, as historical data indicates a propensity for price rejection and subsequent correction around such resistance zones. While past performance is not indicative of future results, the confluence of technical factors underscores the significance of this price range.
One factor contributing to the bearish sentiment is the overextension of the current rally. With the market experiencing an extended period of growth, there is growing concern about unsustainable valuations and the potential for a market pullback. Additionally, macroeconomic uncertainties, including inflationary pressures and geopolitical tensions, further amplify the apprehension among investors.
Moreover, sentiment indicators such as the fear and greed index are signaling heightened investor optimism, often considered a contrarian indicator suggesting potential market reversals. As greed eclipses fear, complacency may set in, leaving the market vulnerable to downside risks.
Investor psychology plays a crucial role in market dynamics, particularly during pivotal moments such as approaching resistance levels. The psychological barrier of reaching a milestone price range can trigger profit-taking among investors, leading to selling pressure and downward price momentum.
Institutional investors, who often have the firepower to influence market movements, may also opt to rebalance their portfolios in anticipation of market headwinds. As such, increased selling activity from institutional players could exacerbate the downward pressure on SPY and the broader market indices.
While the outlook remains uncertain, prudent investors are advised to exercise caution and closely monitor developments in the coming weeks. Key technical levels and market indicators will offer valuable insights into the potential direction of SPY and the broader market.
In conclusion, as the SPY ETF approaches critical resistance levels amidst bearish signals, investors brace for a possible shift in market sentiment. With the $500 to $520 range looming ahead, caution is warranted as historical precedents and technical indicators point to the potential for a corrective phase. Vigilance and adaptability will be essential for navigating the evolving market landscape in the months ahead.

Retracement in market movementsI've noticed a rejection occurring at the 465.00 level, followed by a retest at 463.00, aligning with yesterday's closing price. This suggests that the day will conclude with the establishment of a trading range, potentially paving the way for selling opportunities leading into the weekend for (SPY).

Looking for Price to Revert Back to 50-day SMA MeanIt appears that AMEX:SPY has reached an excess high. Additionally, traders should also be aware that the 50-day SMA has fallen below the 100-day SMA (bearish signal). Furthermore, bull rallies that are made on declining volume generally provide a more quality trade setup to the downside. Lastly, traders should also notate that the 14-day stochastic indicator is also giving a strong overbought reading at 93.81.


If it is TRUE that the story repeats - SPY DOWNTRENDMy prediction for SPY. I considered exactly the last bearish market Decemeber 2021 until October 2023. I rebuild exactly the same movements in photoshop and it came out something that could be extremely realistic.

👑 SPY 🗝️LEVELS TO WACTH👀Hello, traders! 👋 Welcome to another technical analysis. Today, we're taking a closer look at SPY.
The chart illustrates a symmetry AB=CD pattern, which appears to be bullish on its daily chart. The price has reached an important support level at "D" 422.30000.
The strategy is straightforward: we will buy above the entry level (EL) at 427.10000 with a confirmed upward trend. Our stop-loss will be placed below the cluster zones at ST: 418.12379.
Our target levels will be as follows:
First target at 62% of AD: 445.20349- 79% of AD: 451.35905
Second target at 127% of AD: 469.70833-162% of AD: 482.52695
If you find this analysis interesting and useful, please show your support by liking and following. Stay tuned for more analyses like this one!

SPY1 Downtrend & Uptrend The Channels of Travel
Downtrend vs Uptrend
possible targets on right of chart

Price retraces from the support of the uptrend line. It appears that sellers are losing momentum towards the support of the uptrend line. Additionally, there is a significant shrinkage in size in the last bearish candle in the trend compared to the previous candle. Additionally, price also recently found support at the $422.03 price level, and you also have additional support at the $412.26 price level. Therefore, the downside potential appears to be minimal.
Furthermore, the current pattern also forms an ascending bullish triangle. Looking for price to rebound from support and break through the neckline of the inverse head and shoulders pattern!

SPY - Are we at Support, or plummeting into recession?With everything going on in the global markets, it’s hard to stay positive about the current market analysis.
But I have to ask, are we really going to go lower, break support, and spiral into a recession?
Obviously I don’t know the answer to that question for sure, but let’s take a look at a few things.
Other than the obvious support levels that I drew on the chart, what is the good the bad , and the ugly with the current US market?
The Good: The jobs market still seems “relatively” strong.
The Bad: The Fed is once again Threatening Rate hikes.
The Ugly: Nobody really knows what’s going on.
What I think (for what it’s worth):
I’m leaning towards a bounce from here, I think we’re not seeing any financial indicators of impending doom at the moment, and I tend to think that the consensus is usually wrong. Any time I’m in the majority of “herd mentality” I have to question if I’ve joined the right team. Most people are screaming “RECESSSION” from the rooftops at the moment (or at least a lot of people are), so I kind of think that we’re still going to move back up from here.
I could be wrong, I’m more of a technical analysis guy than fundamental analysis, so take my word with a grain of salt, and also be careful out there. It’s still pretty crazy out there!

Falling wedge breakoutA breakout of this falling wedge could shoot SPY back into the 450s to fill the gap on the 15 and the 1hr.

SPY SPDR SP500 Long Second-Largest Weekly InflowSector-Financial/Banking ETFs Log Second-Largest Weekly Inflow This Year
Technicals:
Trend
long bullish
Trend continuation confirmation
During LSEG Lipper’s fund flows week that ended June 21, 2023, investors were overall net redeemers of fund assets (including both conventional funds and ETFs) for the first week in three, withdrawing a net of $29.7 billion.
Taxable bond funds (+$2.8 billion) and tax-exempt bond funds (+$672 million) attracted new capital. Equity funds (-$17.0 billion) and money market funds (-$16.1 billion) suffered outflows on the week.
Index Performance
At the close of LSEG Lipper’s fund flows week, U.S. broad-based equity indices reported negative returns - the Russell 2000 (-0.59%), Nasdaq (-0.91%), S&P 500 (-0.16%), and DJIA (-0.08%) were all in the red. For the DJIA, Nasdaq, and S&P 500, this was the first negative return over the last four weeks.
The Bloomberg Municipal Bond Total Return Index (+0.33%) recorded its fourth straight weekly gain. The Bloomberg U.S. Aggregate Bond Total Return Index (+0.64%) logged its third week in the black in four.
Overseas indices traded down - Nikkei 225 (-1.61%), Shanghai Composite (-1.45%), FTSE 100 (-0.29%), and DAX (-0.85%).
Rates/Yields
The 10-two Treasury yield spread remained negative (-0.99), marking the two hundred and fifty second straight trading session with an inverted yield curve. The 10-year Treasury yield fell 2.28% on the week.
According to Freddie Mac, the 30-year fixed-rate average (FRM) decreased for the third straight week - currently at 6.67%. Both the United States Dollar Index (DXY, -0.85%) and VIX (-5.15%) fell over the course of the week.
Market Recap
Our fund flows week kicked off on Thursday, June 15, with the weekly initial jobless claims data showing seasonally adjusted initial claims was 264,000. The four-week moving average was 255,750 - an increase of 8,500 from the previous week’s revised average and the highest four-week average level since November 13, 2021. The U.S. Census Bureau also announced the Advance Monthly Sales for Retail and Food Services report highlighting estimates of U.S. retail and food services sales were up 0.3% from the previous month and up 1.6% from 12-months ago - many forecasts had a monthly decline (-0.1%). Equity markets fared well on the day, both the S&P 500 (+1.22%) and Nasdaq (+1.15%) logged their sixth straight daily gain following Federal Reserve Chair Jerome Powell’s announcement that the Fed will not increase interest rates this earlier week.
On Friday, June 16, the University of Michigan published their consumer sentiment report detailing an increase in the U.S. to 63.9, marking the highest level in four months. These figures also beat forecasts, reflecting there may be greater market optimism than originally thought with the debt ceiling drama passed (for now) and inflation trending downward (for now). Treasury yields rose on the day, led by the five-year yield (+1.89%). Equity markets fell on the day - Russell 2000 (-0.73%), Nasdaq (-0.68%), S&P 500 (-0.37%), and DJIA (-0.32%).
On Monday, June 19, markets were closed in the U.S. in recognition of Juneteenth.
On Tuesday, June 20, President Joe Biden stated that U.S. and China ties are on the “right trail,” saying that progress was made during Secretary of State Antony Blinken’s two-day Beijing trip. The President of the People’s Republic of China Xi Jinping seconded Biden’s comments and said, “China respects U.S. interests and does not seek to challenge or displace the U.S.” He added that the, “U.S. needs to respect China and must not hurt China’s legitimate rights and interests.” The U.S. Census Bureau published its Monthly New Residential Construction that showed privately owned housing starts in May were 21.7 percent above the revised April number. Privately owned housing completions in May were also up (+9.5%) above April’s revised estimate. Both equity markets and Treasury yields fell on the day - DJIA (-0.72%) and S&P 500 (-0.47%), while the 10-year Treasury yield fell (-0.98%).
Our fund flows week wrapped up Wednesday, June 21. Equity markets fell for the third straight day - Nasdaq (-1.21%), S&P 500 (-0.52%), DJIA (-0.30%), and Russell 2000 (-0.20%). Fed Chair Powell came out and insinuated that the central bank’s rate hikes are not done this year, saying, “Earlier in the process speed was very important. It’s not very important now…Given how far we’ve come, it may make sense to move rates higher but to do so at a more moderate pace.” The two-year Treasury yield increased by 0.38% on the day, while the three-, five-, 10-, and 30-year yields all fell.
Exchange-Traded Equity Funds
Exchange-traded equity funds recorded $12.1 billion in weekly net outflows, marking the second weekly outflow in three and third largest this year. The macro group posted a 0.34% loss on the week, its first week in the red over the last four.
Growth/value large cap ETFs (-$6.2 billion), growth/value small cap ETFs (-$2.4 billion), and sector other (-$1.5 billion) were the largest outflows among equity ETF subgroups. Growth/value large cap ETFs reported their largest weekly outflow in 12 weeks while realizing their first weekly loss in four.
Sector financial/banking ETFs (+$949 million), growth/value aggressive ETFs (+$366 million), and sector real estate ETFs (-$79 million) were the largest inflows under the macro group. Despite logging back-to-back weeks of negative performance, sector financial/banking ETFs posted three straight weeks of inflows. This was also the subgroup’s second largest weekly intake on the year.
Over the past fund flows week, the top two equity ETF flow attractors were iShares: Core S&P 500 (IVV, +$2.7 billion) and Invesco S&P 500 Equal Weight (RSP, +$1.2 billion).
Meanwhile, the bottom two equity ETFs in terms of weekly outflows were SPDR S&P 500 ETF (SPY, -$6.0 billion) and iShares: Russell 2000 ETF (IWM, -$2.6 billion).
Exchange-Traded Fixed Income Funds
Exchange-traded taxable fixed income funds observed a $3.1 billion weekly inflow - the macro group’s sixth weekly inflow in seven. Fixed income ETFs reported a weekly return of negative 0.35% on average, their third week in the black in four.
Corporate investment grade ETFs (+$1.8 billion), government Treasury ETFs (+$771 million), and flexible funds ETFs (+$325 million) were the top taxable fixed income subgroups to post inflows over the week. Corporate investment grade ETFs have logged six weeks of inflows over the last seven while realizing back-to-back weeks of plus-side returns.
International & global debt ETFs (-$45 million), corporate high yield ETF (-$13 million), and balanced funds ETFs (-$7 million) were the top taxable fixed income subgroups to witness outflows on the week. International & global debt witnessed their first weekly outflow over the last four, despite four straight weeks of gains.
Municipal bond ETFs reported a $514 million inflow over the week, marking their first outflow in the three weeks. The subgroup realized a positive 0.27% gain, marking fourth straight week in the black.
iShares: iBoxx $Investment Grade Corporates (LQD, +$1.5 billion) and Wisdom Tree: Floating Rate Treasury ETF (USFR, +$436 million) attracted the largest amounts of weekly net new money for taxable fixed income ETFs.
On the other hand, iShares: AMEX:HIGH Yield Corporates ETF (HYG, -$626 million) and Schwab US TIPS ETF (SCHP, -$366 million) suffered the largest weekly outflows under all taxable fixed income ETFs.
Conventional Equity Funds
Conventional equity funds (ex-ETFs) witnessed weekly outflows (-$4.4 billion) for the seventy-second straight week. Conventional equity funds posted a weekly return of negative 0.27%, the first week of losses in four.
Growth/value large cap (-$2.0 billion), international equity funds (-$634 million), and equity income funds (-$624 million) were the largest subgroup outflows under conventional equity funds. Growth/value large cap funds have suffered 26 consecutive weeks of outflows while observing a 0.18% loss on average. The four-week net flow moving average has remained negative for 74 weeks.
Sector technology conventional funds (+$18 million) was the only subgroup to report weekly inflows. This was the third week of inflows over the past for this subgroup.
Conventional Fixed Income Funds
Conventional taxable fixed income funds realized a weekly outflow of $313 million - marking their first weekly outflow over the past three weeks. The macro group logged a positive 0.28% on average - their fourth straight week of gains.
Conventional corporate investment grade funds (+$415 million), corporate high yield funds (+$278 million), and government mortgage funds (+$23 million) reported the largest weekly outflows under taxable fixed income conventional funds. This was the third straight weekly inflow for conventional corporate investment grade funds.
Conventional flexible funds (-$661 million), international & global debt funds (-$144 million), and balanced funds (-$96 million) were the top taxable fixed income macro group to produce outflows. Flexible funds have suffered 15 weeks of outflows in the last 16, despite four consecutive weeks of gains.
Municipal bond conventional funds (ex-ETFs) returned a positive 0.28% over the fund flows week - their seventh weekly gain in nine. The subgroup experienced $158 million in inflow, marking the second inflow in the past three weeks.

SPY TREND- If the price break out 455.97 ---> make Buy with confirmation
- If the price doesn't break out 455.97 ---> make Sell with confirmation
- If the price break down 451.46 ---> make Sell with confirmation
- If the price doesn't break down 451.46 ---> make Buy with confirmation

SPY Bears Ready?How many trees grow from the sky? Looks like this one is ready for a nice correction back to the 200 EMA. RSI is hot and ready for a cool down.

SP500 Giant Bear Flag Daily ChartI dont normally post short ideas, but this one is just too obvious.
Giant bear flag that rejected off resistance and fell through support.
Target is the white line after the rejection.

$SPY FrothThe overall sentiment about AI is wildly disproportionate to current capability. NASDAQ:NVDA trading at 223x P/E is evidence in itself. 5% decline by end of June is reasonable and 8% by Aug 18th. Puts at $405 and $384 respectively.
