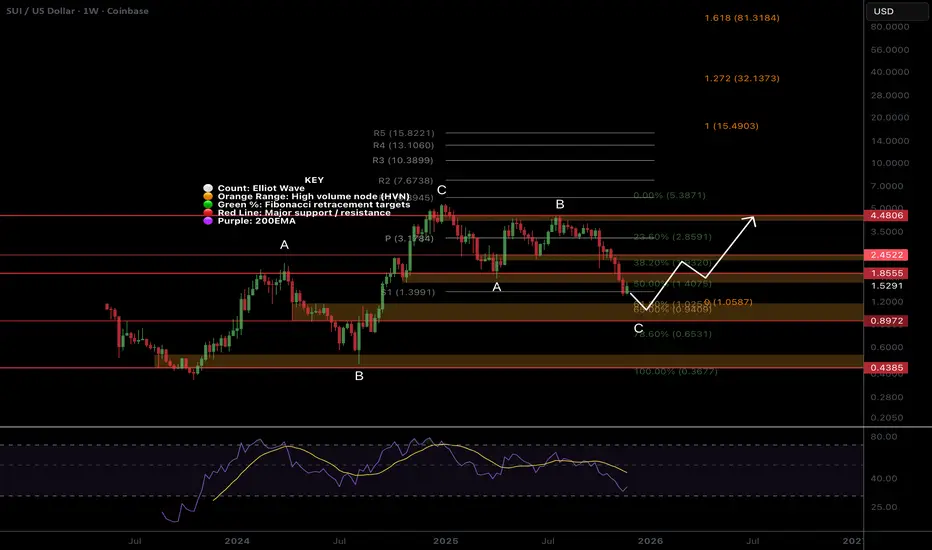
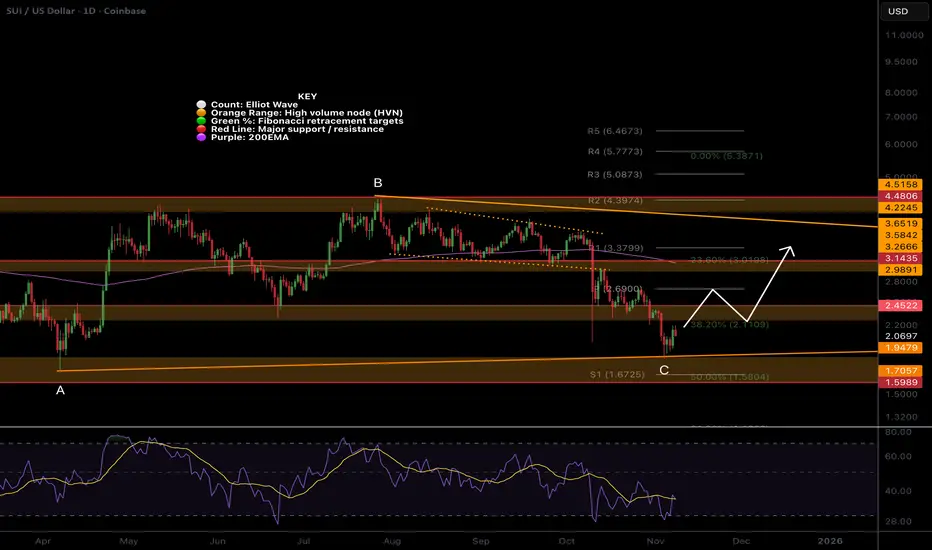
SUI Macro outlook changed...Price appears to be near the completion of a wave C correction.
Price is falling below the S1 pivot, bringing up the next target of the golden pocket and High Volume Node. There is no weekly 200EMA. The series of macro ABC’s suggests upside targets may be limited to the R3 pivot.
🎯 Terminal target
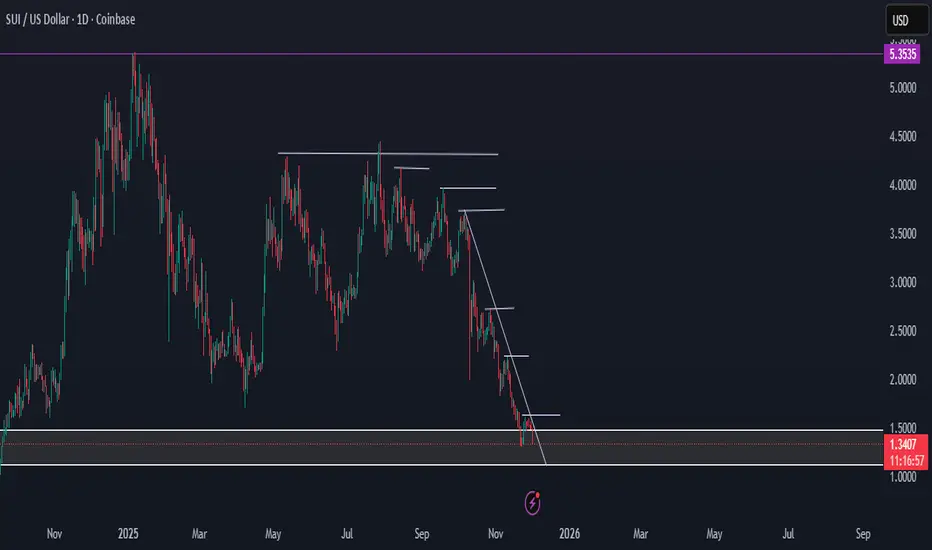
SUI/USD 01 DEC 2025Sui is currently filling in market fair value gap (FVG) $1.50 to about $1.12 if price continues lower after reaching market fair value thinking price will attempt to sweep liquidity around $0.75-$0.65 for some accumulation and bullish movement. Setting alerts for each level of interest.
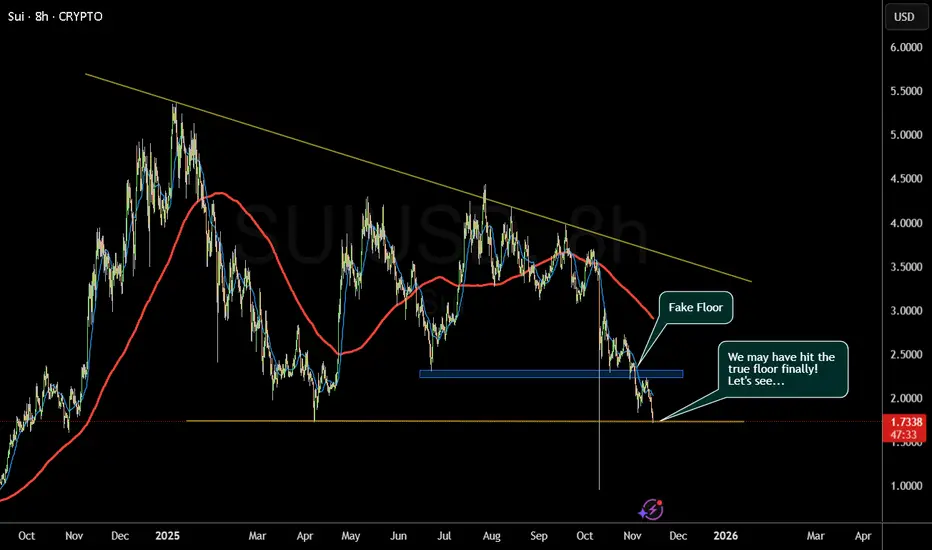
SUI Dropped hard! More to come?Price accelerated in a downtrend, falling below a major High Volume Node support, invalidating the macro triangle.
Wave C of a textbook ABC correction is underway with a target of the golden pocket. and S2 pivot at $1.
📈 Daily RSI is oversold with no divergence
👉 Continued downside has a next tar

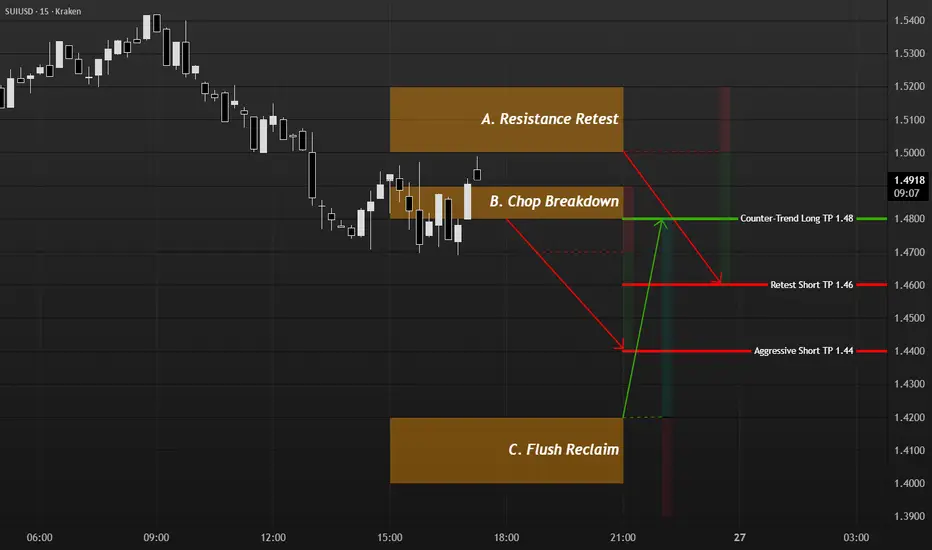
SUI intraday while BTC stallsBTC is chopping at key levels, so I’m not forcing trades there. Instead I’m using SUI on Kraken: strong push up from 1.33 to 1.55 on 24th, then clear distribution and break lower, which gives three structured ideas.
A. Base case: short a failed retest of 1.50–1.52 after rejection, invalidation abov
SUI/USD - Weekly Chart AnalysisThe price action on the weekly timeframe shows SUI moving within a well-defined bullish flag pattern, characterized by a strong impulsive move upward followed by a controlled, downward-sloping consolidation channel.
🔹 Pattern Structure
The overall structure forms a bullish flag, which is typically

SUI Technical Analysis — Is a Major Reversal Coming?SUI is currently moving inside a large descending channel, consistently respecting both the upper and lower trendlines. Price is now approaching a critical decision zone where two scenarios become likely.
Bearish Scenario (Red Path)
If the current weakness continues, SUI may drop toward the botto

SUIUSD; Heikin Ashi Trade Idea📈 Hey Traders!
Here’s a fresh outlook from my trading desk. If you’ve been following me for a while, you already know my approach:
🧩 I trade Supply & Demand zones using Heikin Ashi chart on the 4H timeframe.
🧠 I keep it mechanical and clean — no messy charts, no guessing games.
❌ No trendlines, no

SUI-eet Setup????This could be a textbook reversal structure for SUI but this market has been so unpredictable, who knows. Regardless, this is an EXCELLENT entry opportunity for long term holders!!!!
SUISUI Long idea. Interesting if they break ~$2.175. There is also a potential dragon here with classic bullish divergence on the oscillators.

SUI remains in a shallow Fib triangleCRYPTOCAP:SUI Price remains in a downtrend, falling below a major High Volume Node support, tapping the macro triangle lower boundary.
Wave C of the triangle appears complete. If this count is correct, we should accelerate to the upper boundary around $3.6 over the next month or so, with some diff
See all ideas
Summarizing what the indicators are suggesting.
Oscillators
Neutral
SellBuy
Strong sellStrong buy
Strong sellSellNeutralBuyStrong buy
Oscillators
Neutral
SellBuy
Strong sellStrong buy
Strong sellSellNeutralBuyStrong buy
Summary
Neutral
SellBuy
Strong sellStrong buy
Strong sellSellNeutralBuyStrong buy
Summary
Neutral
SellBuy
Strong sellStrong buy
Strong sellSellNeutralBuyStrong buy
Summary
Neutral
SellBuy
Strong sellStrong buy
Strong sellSellNeutralBuyStrong buy
Moving Averages
Neutral
SellBuy
Strong sellStrong buy
Strong sellSellNeutralBuyStrong buy
Moving Averages
Neutral
SellBuy
Strong sellStrong buy
Strong sellSellNeutralBuyStrong buy
Displays a symbol's price movements over previous years to identify recurring trends.