SUI: The Power of ConfluenceSUI just delivered one of the cleanest moves. After sweeping the liquidity low at $1.3111, price launched nearly +40% in under two days, ripping through a full 5-wave impulse and breaking market structure. Now that the fast move is done, the real question is:
Where’s the next high-probability setup?
To answer that, we break down the support/resistance zones, VWAP structure, Fibonacci levels, and market cap confluence that are now forming.
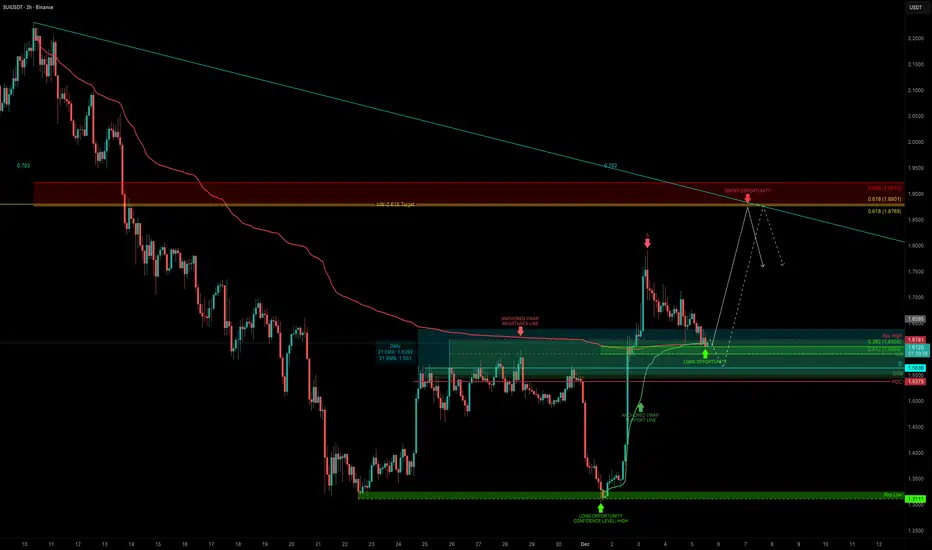
1. The Key Support Cluster at $1.60
To map the next setup, we first look for strong support. And right now, $1.60 is loaded with confluence:
Anchored VWAPs from both the swing low ($1.3039) and swing high ($2.231) meet at roughly $1.60
Fibonacci Retracement
The 0.382 retracement of the entire impulse sits exactly at $1.60. After fast moves, holding the 0.382 is typically what you want to see for bullish continuation.
Dynamic EMAs & SMAs: Daily 21 EMA → $1.64, Daily 21 SMA → $1.55.
These are dynamic tools, so they shift over time, but both are already closing in on the same zone.
Daily level at $1.5636
POC of the previous range at $1.5375.
Both overlap with the daily order block, adding confidence.
Monthly Anchored VWAP.
Currently around $1.5782, giving this area even more weight.
Market Cap Confluence
$1.60 ≈ 6B market cap
$1.87 ≈ 7B market cap
I like using market caps as macro support/resistance, and these levels line up beautifully. All in all, $1.55–$1.60 is shaping up as the main demand zone.
2. Upside Target → the 0.618 Fib
Using the retracement from the downward move
($2.231 → $1.3039), the 0.618 Fib sits at $1.8768.
This also lines up with the 7B market cap and previous resistance structure.
That makes it the main target for the next leg up.
3. Risk Management
An entry between $1.60-$1.55 with an SL below the POC / order block allows for:
R:R between 1:4 and 1:6 (depending on how you ladder)
Clear invalidation
Strong structural backing
Multiple layers of confluence
Summary
SUI swept a major low, completed a sharp impulse, and broke market structure. Now it’s retracing into what looks like a high-confluence long zone around $1.55–$1.60. If this support zone holds, the next target is $1.87, giving a clean and logical long setup with solid R:R.
🔍 Indicators used
Multi Timeframe 8x MA Support Resistance Zones → to identify support and resistance zones such as the daily 21 EMA/SMA.
➡️ Available for free. You can find it on my profile under “Scripts” and apply it directly to your charts for extra confluence when planning your trades.
_________________________________
💬 If you found this helpful, drop a like and comment!
Trade ideas
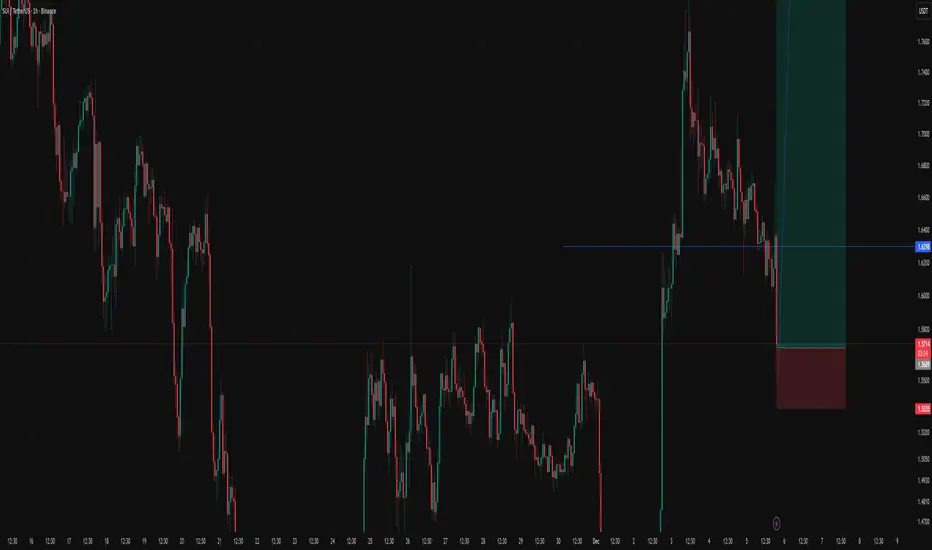
SUI/USDT : LIMITHello friends
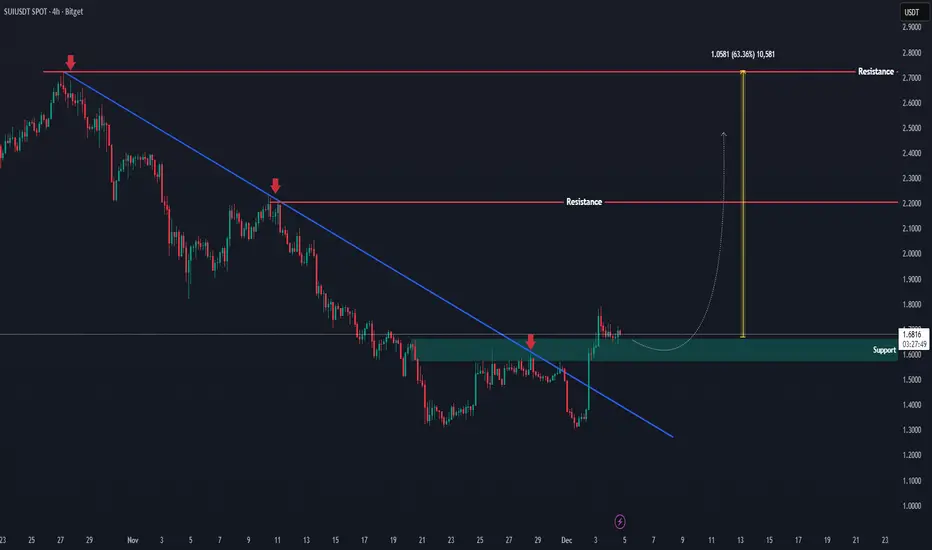
As you can see, after the resistance level we set was broken, the price has grown well, and now with this bullish trend, there is a sign of sellers entering, and there is a possibility of price correction, and the price can grow again from these areas and move to our targets.
This analysis is technically reviewed and is not a buy or sell recommendation, so please follow risk and capital management.
*Trade safely with us*

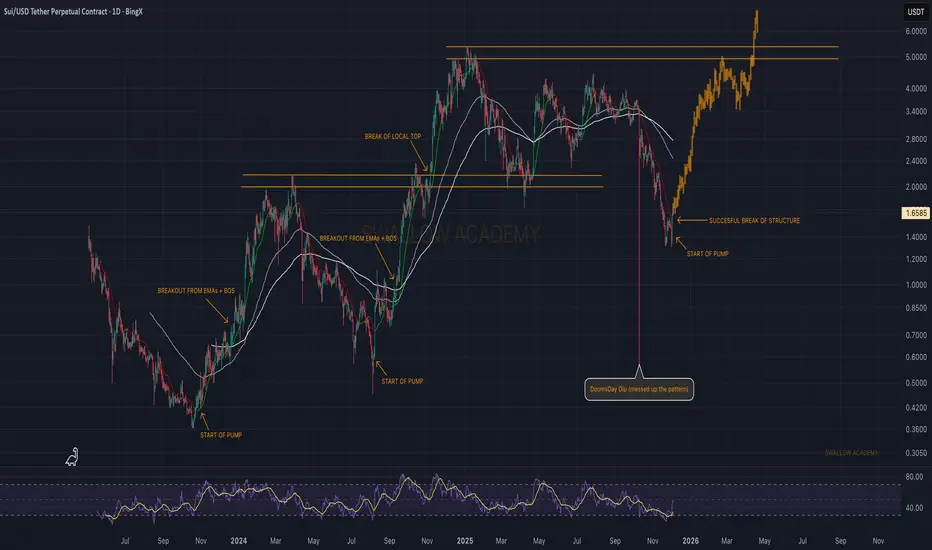
Sui (SUI): Expecting a Good Upside Movement From Here | BullishSUI has repeated the same pattern multiple times: breakout from EMAs → BOS → clean push. Every strong leg up basically started the same way, and we’re seeing that structure again. After the doomsday dump messed up the previous cycle, buyers stepped in aggressively and reclaimed the key zones.
Now with a successful break of structure and momentum shifting, SUI is showing signs of starting a new pump phase similar to previous runs. As long as buyers keep securing the EMAs and hold above the reclaimed zone, upside continuation stays the main idea.
Swallow Academy
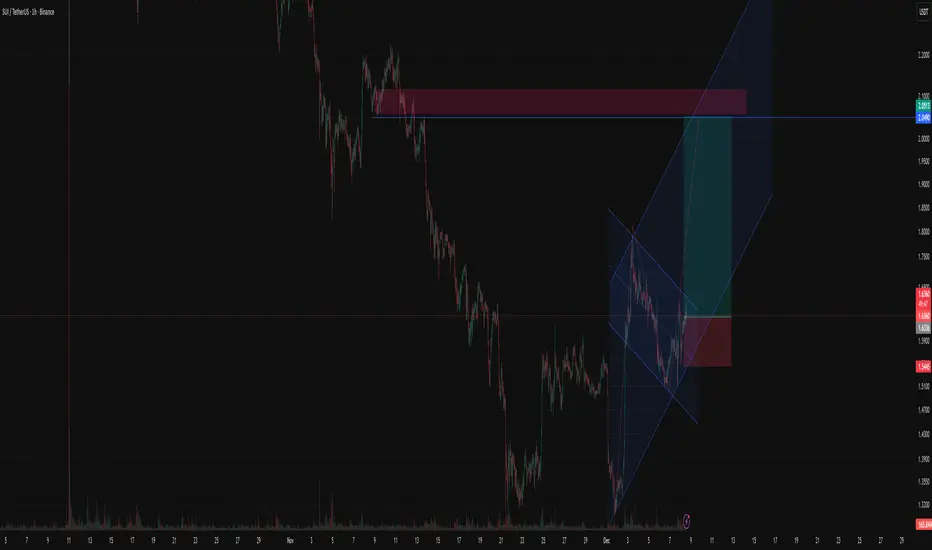
SUI Second Entry for Target 2$The Shape That formed for Sui Show us it will explode like before wave . Really fast rising that you can't wait retracement for another entry . Risk management Is very necessary for Entering.
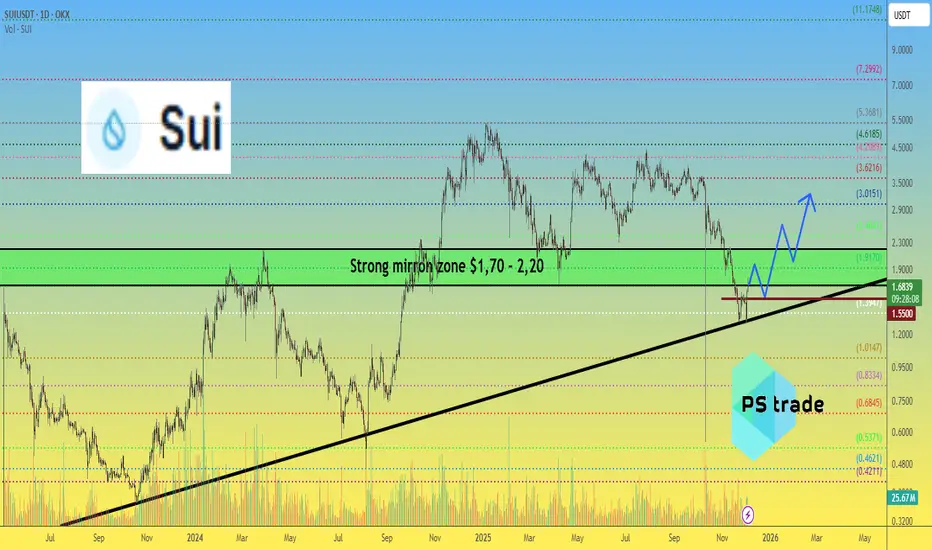
SUI price Update — Double Bottom & Next Targets📉 In November, the price of CRYPTOCAP:SUI was saved twice right at the edge — perfectly on the trendline support, forming a classic double bottom.
📈 Yesterday we finally saw the effect: a strong +30% pump, and the full technical target of this pattern points directly toward $2.
But what comes next is where it gets interesting:
🔹 Buyers must not allow OKX:SUIUSDT to drop below $1.55 — that’s the critical structural level.
🔹 Then CRYPTOCAP:SUI needs to break out and firmly hold above the mirror zone at $1.70–2.20.
🔹 And afterward… it must push through $3, opening the road to much bigger levels.
🎯 Just a few “simple” steps 😄 — and the pathway toward $7, or even $11, becomes fully realistic for #SUI.
🤔 What do YOU think: is CRYPTOCAP:SUI entering its next expansion phase?
______________
◆ Follow us ❤️ for daily crypto insights & updates!
🚀 Don’t miss out on important market moves
🧠 DYOR | This is not financial advice, just thinking out loud
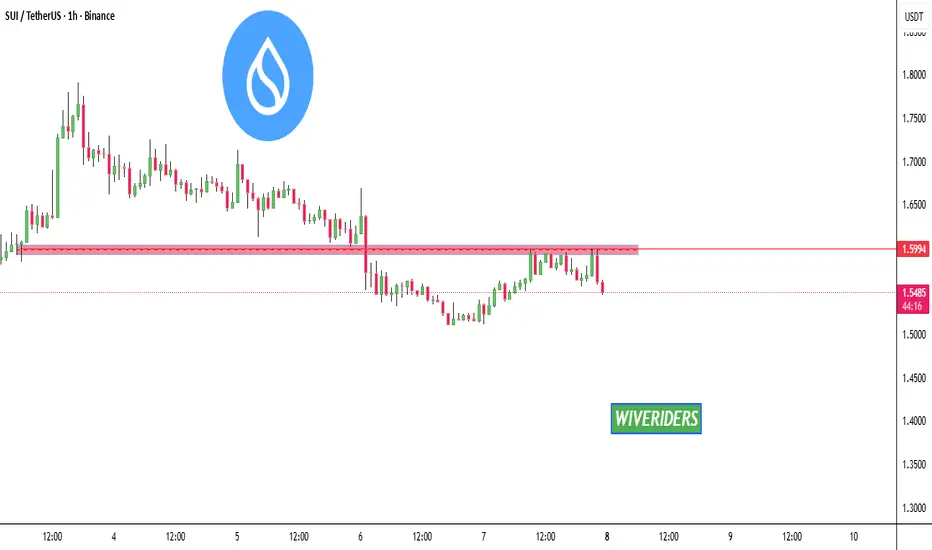
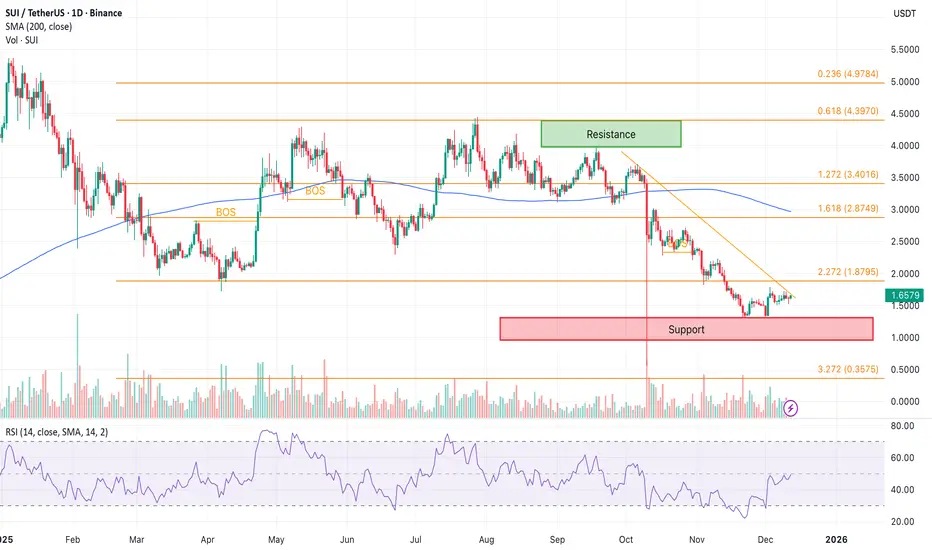
SUI Price Analysis: Trader Watches a Possible Fakeout-and-Bounce* SUI rests on key support at $1.51, and traders are closely watching for either a breakdown or a short fakeout bounce.
* The upside remains capped by higher timeframe resistance, keeping the big trend under pressure despite the early stages of short-term stabilization.
* Momentum shows the selling pressure is easing, though there's no confirmation without a solid reclaim of the resistance.
When you step back and look at SUI’s recent price action, it’s pretty clear the market has calmed down compared to where it was a few weeks ago.
After a long slide lower and a deep pullback from its all-time high, the SUI price has settled into a zone where buyers keep showing up. That $1.51–$1.53 area has been tested several times now, and each dip into it has been met with buying.
Lately, the tone of the SUI chart has started to change. Volatility has tightened up, sell-offs aren’t lasting as long, and RSI has stopped drifting lower and begun to stabilize. It feels like sellers are losing urgency, which is often what happens before the market makes a decision.
That said, the hard part is still ahead. The SUI price has bounced from this support before, only to stall out near the $1.70–$1.80 range. That zone has rejected price every time so far, so until it’s cleared, the bigger downtrend is still technically in place. That’s why this consolidation matters so much, it’s not just about bouncing, it’s about whether the bounce actually sticks.
If the SUI price dips slightly below $1.51 and then quickly snaps back, the fakeout-and-bounce setup becomes much more convincing. In that scenario, a move toward the $1.70–$1.78 area starts to make sense, especially if momentum keeps improving.
If $1.51 breaks cleanly, though, the picture changes quickly. The price could slide back into lower demand zones, and SUI may need more time to build a proper base.
So where does that leave SUI right now?
It’s no longer in free fall, but it hasn’t confirmed a real reversal either. Everything comes down to how the SUI price behaves around $1.51. Hold it, and a relief move stays possible. Lose it, and patience will be needed again.
For now, SUI is sitting at one of those moments where the next move could define the next few weeks, and traders are watching closely.
For the full technical picture on SUI and a detailed breakdown of this setup, the complete article is available on CoinCodex:
coincodex.com
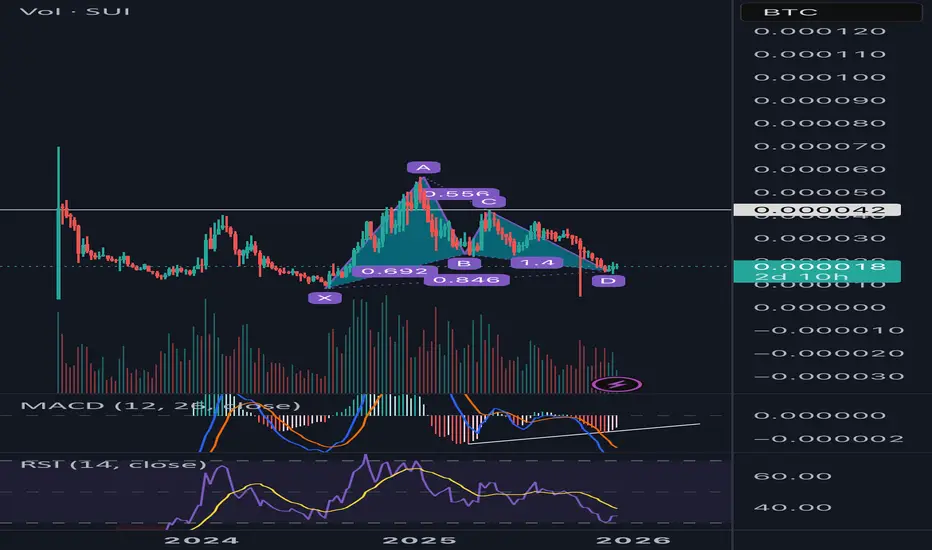
SUI/BTC Weekly: One of the Cleanest Bullish Bat PatternSUI/BTC has just completed a textbook Bullish Bat harmonic exactly at the 0.886 XA retracement while simultaneously finishing a 7-month falling wedge. This is rare high-timeframe confluence that historically leads to violent altcoin outperformance against Bitcoin — exactly the type of setup that kicks off altseason rotations.Chart Overview (1W SUI/BTC) Multi-month falling wedge since July 2025 high
Price has respected the lower wedge boundary 4 times
Exact completion of a Bullish Bat at the 0.886 retracement (PRZ = 0.0000138–0.0000142)
Current price sitting at ~0.000018 (rejection candle off the PRZ)
Bullish Bat Measurements (all ratios within tolerance) XA: base leg
AB = 0.692 retracement of XA
BC = 0.556 retracement of AB
CD = 1.40 extension of BC
XD = 0.846 (target 0.886 hit with <5% error) → perfect Bat completion
Additional Confluence MACD histogram flipping positive + bullish crossover forming
RSI broke its multi-month downtrend at the exact low
Volume spike at the PRZ + declining volume on the pullback = exhaustion
Pattern sits inside the larger $OTHERS/BTC falling wedge that is also approaching apex
Narrative Fuel (already in motion) Sui TVL exploding past $2.6B
USDS stablecoin (Stripe-backed), wBTC integration, ETF filings
Highest fees & real revenue among new L1s
Institutional products launching (Grayscale Trust, 21Shares/Bitwise filings)
Conclusion
This is not just another altcoin setup — it’s a weekly harmonic reversal inside a multi-month falling wedge with momentum and fundamentals aligning perfectly.
Setups like this have preceded the strongest alt/BTC moves of previous cycles.
SUI is positioned to lead the next leg of altseason when Bitcoin dominance finally cracks.Risk management: Keep invalidation tight, but conviction can be high.
This is the type of structure you look back on and say “that was the bottom.”Position: Long SUI (spot or responsible leverage)
Timeframe: 2–12 weeks for initial move, potential multi-month runner Let the wedge break and the Bat fly.
SUI Just Broke Out — A Big Move Might Be Loading!!SUI has finally broken out from its extended downtrend, showing a clean breakout above the descending structure. Price is now retesting the previous rejection zone, which has flipped into an important support area after the breakout.
If this retest holds, the chart suggests a potential continuation toward the next major resistance zone. The structure is showing early signs of a bullish reversal, with momentum beginning to shift to the upside.
For now, the key focus is how price reacts at this reclaimed zone — a strong confirmation here could open the path for a larger move upward.
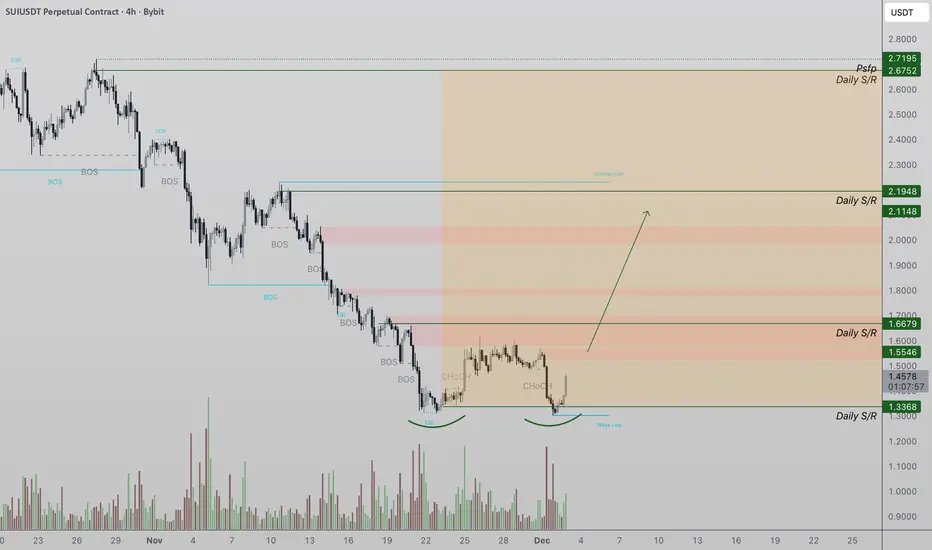
Sui (SUI) Update, Double Bottom? Sui has formed a bullish double bottom at the $1.32 support zone after an extended downtrend of lower highs and lower lows. The pattern now looks ready for confirmation.
The key level to break is the neckline around $1.66, which sits directly above a bearish order block. A strong close above this region could trigger momentum toward $2.19.
Key Points:
- Double bottom forming at $1.32
- Neckline resistance around $1.66
- Next major target at $2.19
What to Expect:
A breakout above $1.66 could ignite a trend reversal. Failure to do so may lead to continued consolidation around support.
#SUI/USDT Could switch sides soon. Be ready#SUI
The price is moving in a descending channel on the 1-hour timeframe. It has reached the lower boundary and is heading towards breaking above it, with a retest of the upper boundary expected.
We have a downtrend on the RSI indicator, which has reached near the lower boundary, and an upward rebound is expected.
There is a key support zone in green at 1.33. The price has bounced from this zone multiple times and is expected to bounce again.
We have a trend towards consolidation above the 100-period moving average, as we are moving close to it, which supports the upward movement.
Entry price: 1.35
First target: 1.38
Second target: 1.42
Third target: 1.46
Don't forget a simple principle: money management.
Place your stop-loss below the support zone in green.
For any questions, please leave a comment.
Thank you.

SUIUSDT Forming Falling WedgeSUIUSDT is forming a clear falling wedge pattern, a classic bullish reversal signal that often indicates an upcoming breakout. The price has been consolidating within a narrowing range, suggesting that selling pressure is weakening while buyers are beginning to regain control. With consistent volume confirming accumulation at lower levels, the setup hints at a potential bullish breakout soon. The projected move could lead to an impressive gain of around 140% to 150% once the price breaks above the wedge resistance.
This falling wedge pattern is typically seen at the end of downtrends or corrective phases, and it represents a potential shift in market sentiment from bearish to bullish. Traders closely watching SUIUSDT are noting the strengthening momentum as it nears a breakout zone. The good trading volume adds confidence to this pattern, showing that market participants are positioning early in anticipation of a reversal.
Investors’ growing interest in SUIUSDT reflects rising confidence in the project’s long-term fundamentals and current technical strength. If the breakout confirms with sustained volume, this could mark the start of a fresh bullish leg. Traders might find this a valuable setup for medium-term gains, especially as the wedge pattern completes and buying momentum accelerates.
✅ Show your support by hitting the like button and
✅ Leaving a comment below! (What is your opinion about this Coin?)
Your feedback and engagement keep me inspired to share more insightful market analysis with you!

SUI Rally Cooling Off – Long Opportunity on Pullback!SUI has seen a massive rally over the past 24 hours, breaking out with strong bullish momentum. As price begins to cool off, we’re watching for a healthy pullback that could present a great long spot entry opportunity.
📉 Entry Zone: $1.36 – $1.50
🎯 Take Profit Targets:
• TP1: $2.20 – $2.50
• TP2: $3.00 – $3.30
🛑 Stop Loss: $1.30
The recent surge indicates strength, but after such explosive movement, a retest of support is likely before continuation. Patience is key—wait for the dip into the zone and monitor how price reacts. If support holds, this could be a strong mid-term trade setup.
SUIUSDT- Short PositionOveral structure Brearish SL above recent liquidity TP will be the recent demand zone

Vanguard Listing Sparks $SUI MomentumVanguardGroup , one of the world’s biggest and most influential asset managers, has added CRYPTOCAP:SUI through both 21Shares_US and BitwiseInvest 10 .
This is a huge win for SuiNetwork and underscores the kind of upside it could have heading into the next bull run and altseason.
CRYPTOCAP:SUI has already filled about 70% of its liquidation wick. Price ripped off the $1.30 low and pushed straight through $1.79.
If $1.60 holds in the short term, a move toward $1.90–$2 is still on the table before any retrace back toward $1.50. Even with a minor pullback, bulls remain in control. And if $1.50 gets flipped into support, that area could offer a solid long setup targeting $2.30–$2.50.

SUIUSDTI think the time is getting closer. Your buy or sell decision is under your responsibility — this is only a chart analysis based on my study.

SUI/USDT : SELL LIMIT
Hello friends
you can see that the price is moving in a range with a slight upward slope, and every time it hits the specified support, the power of buyers decreases, and now, in the last hit that we have identified, it seems that the price will not be able to record a higher ceiling and we will witness a price drop.
This analysis is purely technically reviewed and is not a buy or sell recommendation, so do not act emotionally and observe capital management.
*Trade safely with us*

Sui 70% up & 70% Down ! Really Interesting My Idea of SUI its up 60 -70 percent higher from local bottom that formed few Days ago . After this move it can 70 percent crashes ! I'm READY for the Big crash.

FireHoseReel | SUI Under Strong Accumulation Pressure🔥 Welcome to FireHoseReel!
Let’s jump into the SUI analysis.
👀 SUI – 4H Overview
After forming a double-bottom structure around $1.34, SUI has started moving higher and is now approaching its major resistance with strong buying momentum.
📊 SUI Volume Analysis
SUI volume has increased significantly, while selling pressure has weakened. This shift is allowing price to move higher smoothly.
As long as buy volume remains sustained, SUI can continue the upside move it has initiated.
✍️ SUI Trading Scenarios
🟢 Long Scenario
A break above $1.5855, confirmed by continuing buy volume, activates the long setup.
Ideally, wait for a reaction → pullback with lower volume → renewed volume expansion to enter with an early trigger and better risk control.
🔴 Short Scenario
A break below the current double-bottom support at $1.3144, accompanied by a strong increase in sell volume, could provide a valid short setup.
❤️ Risk Management & Emotional Discipline
Crypto trading is highly risky. Without proper risk management and emotional control, trading is no different from gambling.
Logic must always come before emotions. Learn to manage your trades—and enjoy the process with control and discipline.

SUICRYPTOCAP:SUI is trading inside a clean descending channel pattern and the structure is setting up for a major reversal. From the current price to the measured target there is a potential 350 percent gain. Momentum is coiling and this setup looks ready to expand.

Start of a full-blown uptrend: 2.0-2.1446
Hello, traders!
Follow us to get the latest information quickly.
Have a great day!
-------------------------------------
(SUIUSDT 1M chart)
To continue the uptrend, the price must rise above the M-Signal indicator on the 1M chart and hold.
Accordingly, the key question is whether the price can rise above the 2.0-2.1446 range and maintain its upward momentum.
If the upward movement fails, we should observe whether the M-Signal indicator on the 1M chart moves sideways until it declines near the Fibonacci level of 0.236 (1.3434).
-
(1W chart)
The key question is whether the price can find support and rise near the newly forming DOM (-60) ~ HA-Low range (1.4969-1.8396).
Based on the basic trading strategy, the target range is around the 4.2272-4.7328 range.
However, caution is advised when trading, as the price is currently forming below the M-Signal indicator on the 1M chart.
Therefore, I think it's best to start trading after confirming whether the price rises to around 2.0-2.1446 and maintains its strength.
-
(1D Chart)
When analyzing charts, it's best to observe the movements of the 1D chart as a basic trading strategy.
This is because most indicators are derived from the 1D chart.
In this sense, the key is whether the price can find support and rise around the 1.3451-1.5174 range, which is the DOM(-60) ~ HA-Low range on the 1D chart.
As mentioned earlier, to sustain the uptrend from a long-term perspective, the price must remain above the M-Signal indicator on the 1M chart. Therefore, the current price level is not suitable for trading.
A decline in the DOM(-60) ~ HA-Low range could lead to a step-down trend.
This means that the price is renewing its low, but it can also be considered a time for a split buy.
Therefore, you should consider how to execute a split buy before starting a trade.
If the price rises from the DOM(-60) to HA-Low range, the HA-High to DOM(60) range will form.
Therefore, if you bought near the DOM(-60) to HA-Low range, you should sell near the HA-High to DOM(60) range.
However, if the price rises from the HA-High to DOM(60) range, it's likely to form a step-up trend, so it's recommended to sell in steps.
As mentioned earlier, a step-up trend, like a step-down trend, means that the price is renewing its high.
Therefore, since a sharp decline is possible at any time, it's advisable to sell in steps at the appropriate time to secure profits.
-
In summary, if you encounter the DOM(-60) or HA-Low indicators, you should focus on finding the right time to buy and consider how to execute the split purchase.
Furthermore, if you encounter the DOM(60) or HA-High indicators, you should focus on finding the right time to sell and consider how to execute the split purchase.
This is the basic trading strategy.
If not, and you buy when the HA-High ~ DOM(60) range supports and rises, or sell when the DOM(-60) ~ HA-Low range resists and falls, it's best to maintain your stop loss.
-
Thank you for reading to the end.
I wish you successful trading.
--------------------------------------------------

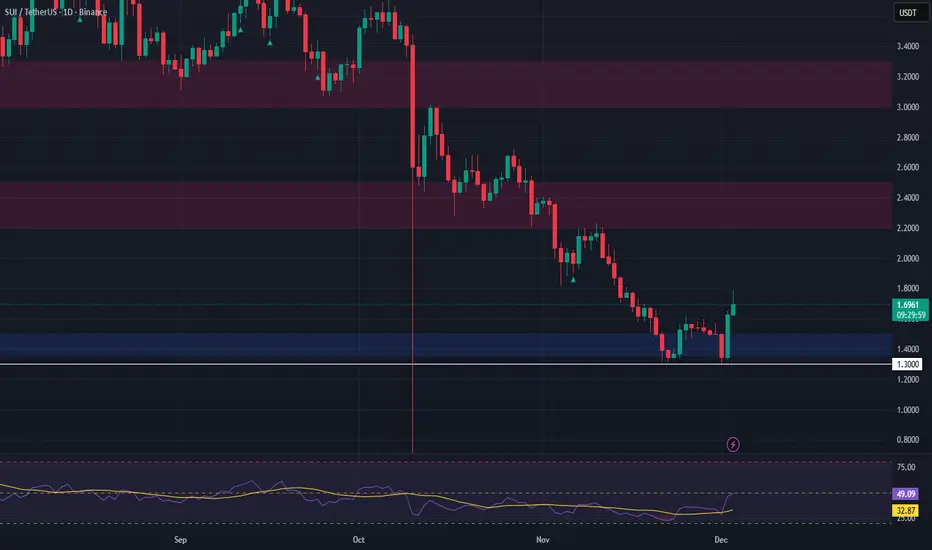
SUI/USDT - Market StructurePrice is attempting a reversal via a double bottom.
The key resistance at the moment is the prior low zone at $1.70–1.90.
RSI is also capped near the 50 level, preventing a move into bullish territory.
On the weekly chart , the only potential reversal signal so far is extreme RSI oversold conditions — no other confirmations yet.
Current structure allows for a long setup with clearly defined risk:
— stop-loss below $1.50.
Since price is trading inside a channel, the majority of the position should be taken off just below the channel midline.

SUI failed to break out above the red resistance zone🚨📊 SUI Update
SUI failed to break out above the red resistance zone 🔴
and got rejected, confirming strong seller presence.
As long as price stays below this level,
upside remains limited.