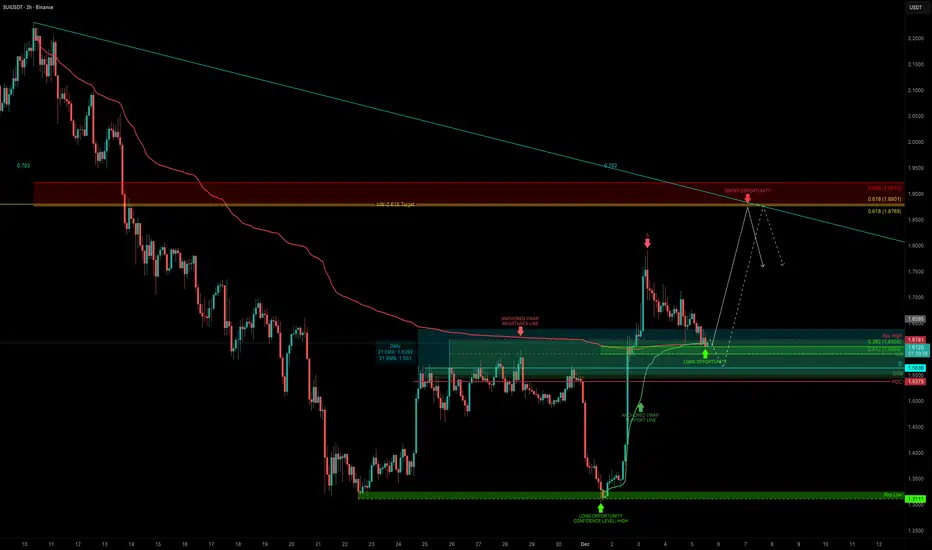
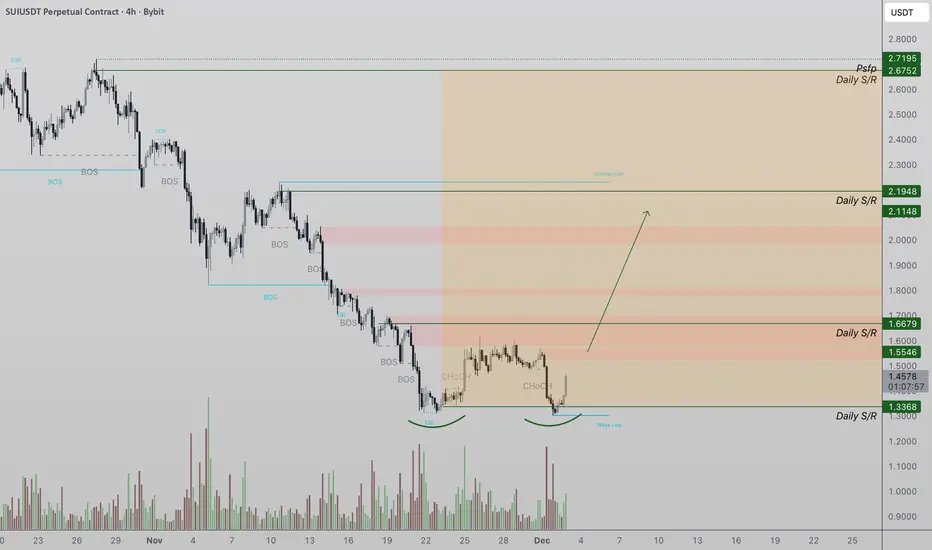
SUI: The Power of ConfluenceSUI just delivered one of the cleanest moves. After sweeping the liquidity low at $1.3111, price launched nearly +40% in under two days, ripping through a full 5-wave impulse and breaking market structure. Now that the fast move is done, the real question is:
Where’s the next high-probability setup?
Related pairs
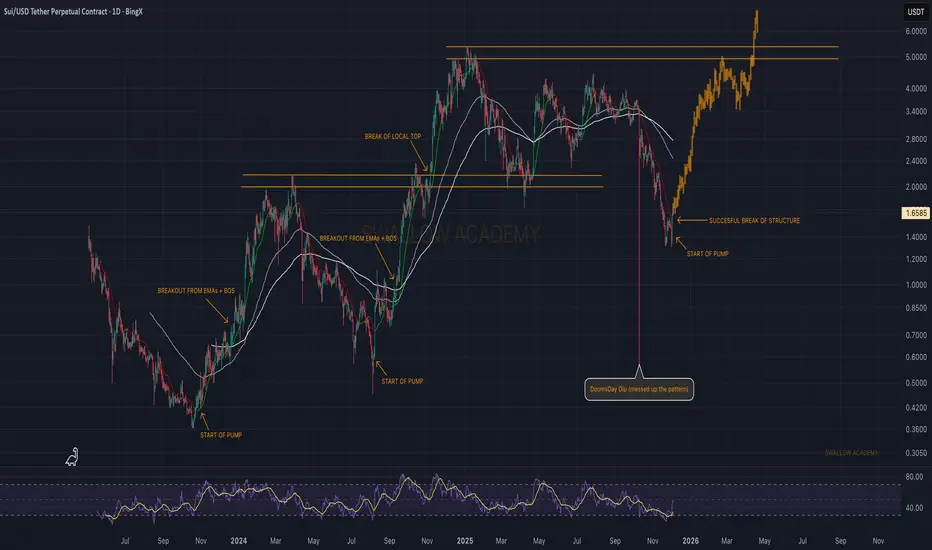
Sui (SUI): Expecting a Good Upside Movement From Here | BullishSUI has repeated the same pattern multiple times: breakout from EMAs → BOS → clean push. Every strong leg up basically started the same way, and we’re seeing that structure again. After the doomsday dump messed up the previous cycle, buyers stepped in aggressively and reclaimed the key zones.
Now w
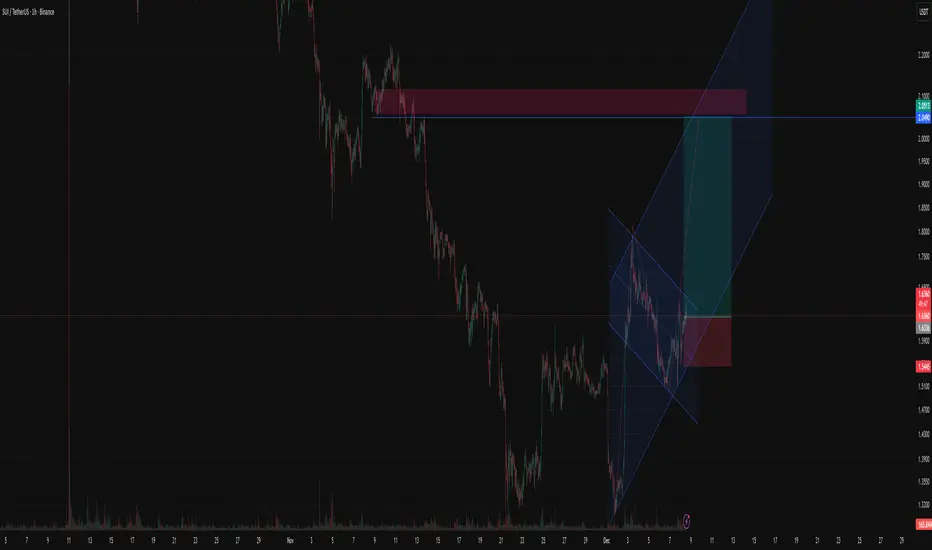
SUI/USDT : LIMITHello friends
As you can see, after the resistance level we set was broken, the price has grown well, and now with this bullish trend, there is a sign of sellers entering, and there is a possibility of price correction, and the price can grow again from these areas and move to our targets.
This an

SUI price Update — Double Bottom & Next Targets📉 In November, the price of CRYPTOCAP:SUI was saved twice right at the edge — perfectly on the trendline support, forming a classic double bottom.
📈 Yesterday we finally saw the effect: a strong +30% pump, and the full technical target of this pattern points directly toward $2.
But what comes n
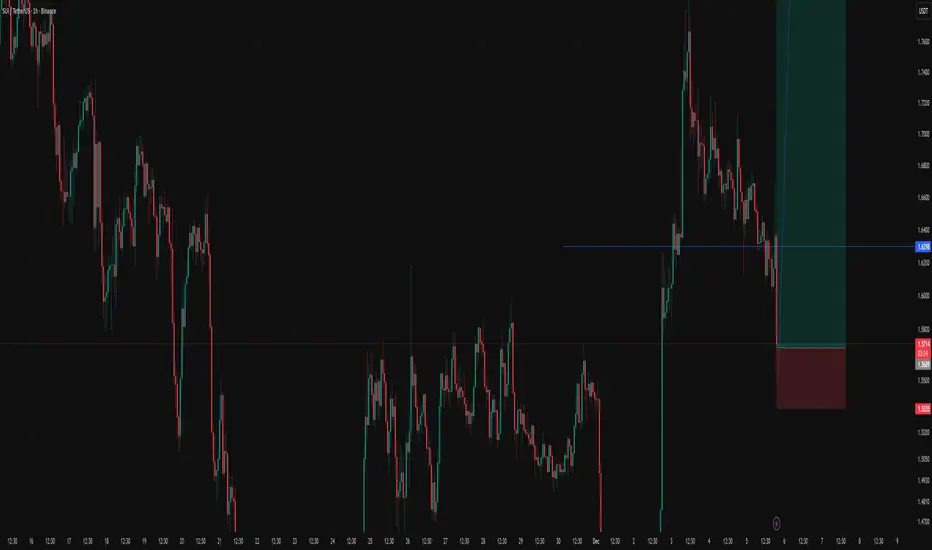
SUI Second Entry for Target 2$The Shape That formed for Sui Show us it will explode like before wave . Really fast rising that you can't wait retracement for another entry . Risk management Is very necessary for Entering.
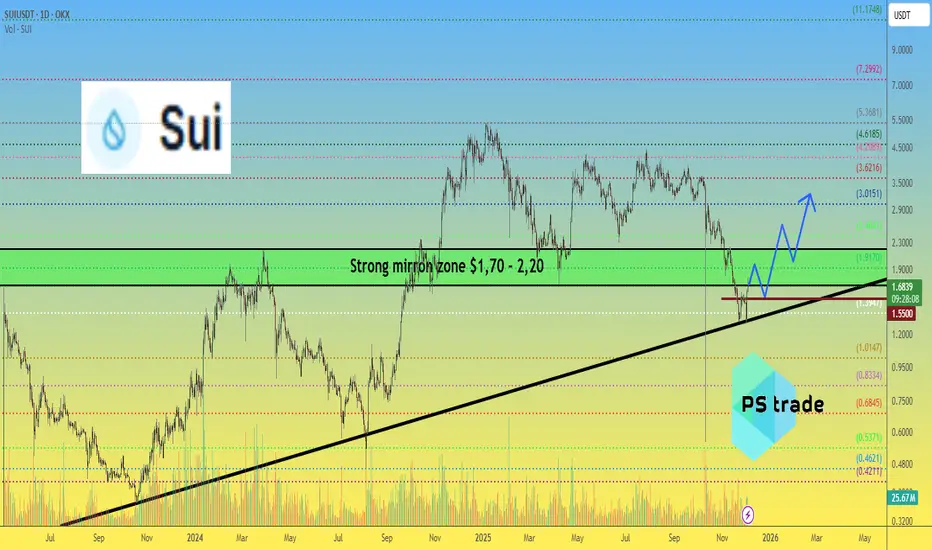
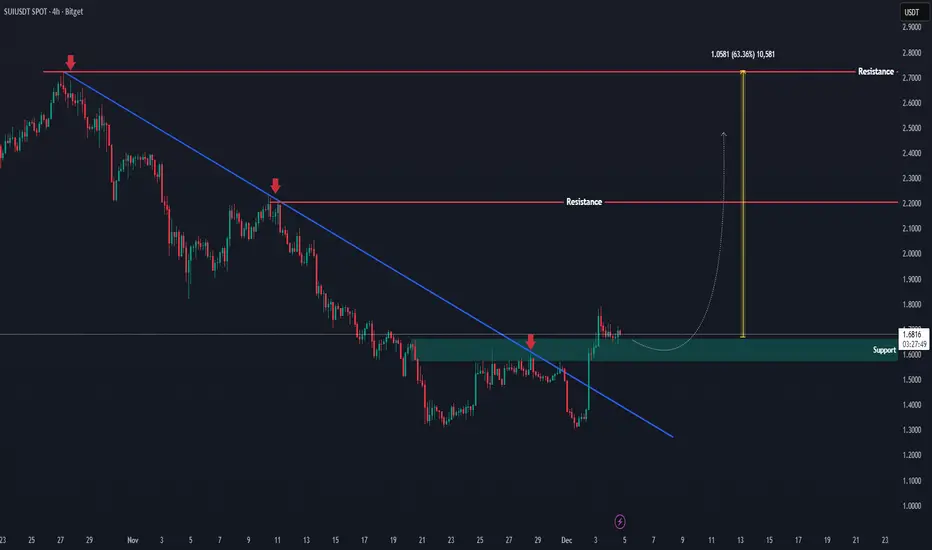
SUI Just Broke Out — A Big Move Might Be Loading!!SUI has finally broken out from its extended downtrend, showing a clean breakout above the descending structure. Price is now retesting the previous rejection zone, which has flipped into an important support area after the breakout.
If this retest holds, the chart suggests a potential continuation
Vanguard Listing Sparks $SUI MomentumVanguardGroup , one of the world’s biggest and most influential asset managers, has added CRYPTOCAP:SUI through both 21Shares_US and BitwiseInvest 10 .
This is a huge win for SuiNetwork and underscores the kind of upside it could have heading into the next bull run and altseason.
CRYPTOCAP

SUI Rally Cooling Off – Long Opportunity on Pullback!SUI has seen a massive rally over the past 24 hours, breaking out with strong bullish momentum. As price begins to cool off, we’re watching for a healthy pullback that could present a great long spot entry opportunity.
📉 Entry Zone: $1.36 – $1.50
🎯 Take Profit Targets:
• TP1: $2.20 – $2.50
• TP2: $
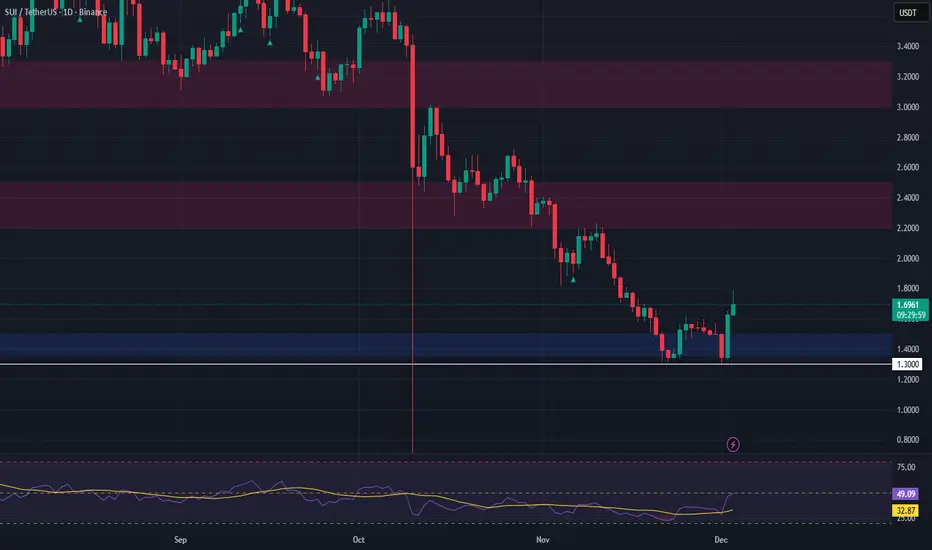
Sui (SUI) Update, Double Bottom? Sui has formed a bullish double bottom at the $1.32 support zone after an extended downtrend of lower highs and lower lows. The pattern now looks ready for confirmation.
The key level to break is the neckline around $1.66, which sits directly above a bearish order block. A strong close above this r
See all ideas
Summarizing what the indicators are suggesting.
Oscillators
Neutral
SellBuy
Strong sellStrong buy
Strong sellSellNeutralBuyStrong buy
Oscillators
Neutral
SellBuy
Strong sellStrong buy
Strong sellSellNeutralBuyStrong buy
Summary
Neutral
SellBuy
Strong sellStrong buy
Strong sellSellNeutralBuyStrong buy
Summary
Neutral
SellBuy
Strong sellStrong buy
Strong sellSellNeutralBuyStrong buy
Summary
Neutral
SellBuy
Strong sellStrong buy
Strong sellSellNeutralBuyStrong buy
Moving Averages
Neutral
SellBuy
Strong sellStrong buy
Strong sellSellNeutralBuyStrong buy
Moving Averages
Neutral
SellBuy
Strong sellStrong buy
Strong sellSellNeutralBuyStrong buy
Displays a symbol's price movements over previous years to identify recurring trends.
Frequently Asked Questions
The current price of SUI / Tether USD (SUI) is 1.6591 USDT — it has risen 1.34% in the past 24 hours. Try placing this info into the context by checking out what coins are also gaining and losing at the moment and seeing SUI price chart.
SUI / Tether USD price has fallen by −1.75% over the last week, its month performance shows a −22.22% decrease, and as for the last year, SUI / Tether USD has decreased by −62.15%. See more dynamics on SUI price chart.
Keep track of coins' changes with our Crypto Coins Heatmap.
Keep track of coins' changes with our Crypto Coins Heatmap.
SUI / Tether USD (SUI) reached its highest price on Jan 6, 2025 — it amounted to 5.3664 USDT. Find more insights on the SUI price chart.
See the list of crypto gainers and choose what best fits your strategy.
See the list of crypto gainers and choose what best fits your strategy.
SUI / Tether USD (SUI) reached the lowest price of 0.1000 USDT on May 5, 2023. View more SUI / Tether USD dynamics on the price chart.
See the list of crypto losers to find unexpected opportunities.
See the list of crypto losers to find unexpected opportunities.
The safest choice when buying SUI is to go to a well-known crypto exchange. Some of the popular names are Binance, Coinbase, Kraken. But you'll have to find a reliable broker and create an account first. You can trade SUI right from TradingView charts — just choose a broker and connect to your account.
Crypto markets are famous for their volatility, so one should study all the available stats before adding crypto assets to their portfolio. Very often it's technical analysis that comes in handy. We prepared technical ratings for SUI / Tether USD (SUI): today its technical analysis shows the neutral signal, and according to the 1 week rating SUI shows the sell signal. And you'd better dig deeper and study 1 month rating too — it's sell. Find inspiration in SUI / Tether USD trading ideas and keep track of what's moving crypto markets with our crypto news feed.
SUI / Tether USD (SUI) is just as reliable as any other crypto asset — this corner of the world market is highly volatile. Today, for instance, SUI / Tether USD is estimated as 4.35% volatile. The only thing it means is that you must prepare and examine all available information before making a decision. And if you're not sure about SUI / Tether USD, you can find more inspiration in our curated watchlists.
You can discuss SUI / Tether USD (SUI) with other users in our public chats, Minds or in the comments to Ideas.