Sonic (Fantom) OutlookSonic, formerly known as Fantom has been on a steady downtrend since Nov 2024. It's already one-sixteenth compared to that time. Let's see if it rises from here!
Related pairs

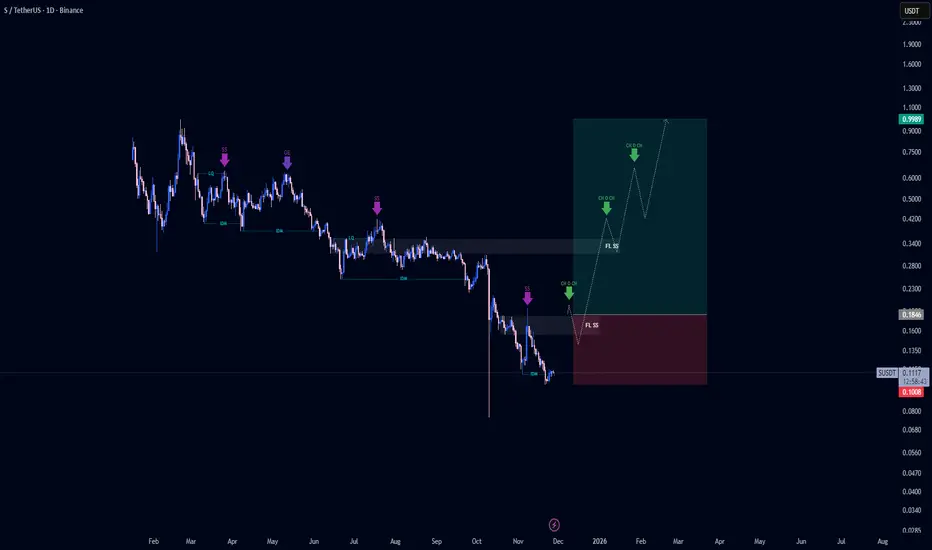
Based on the liquidity structure and price reading method (RTM)My personal view on this currency is clearly visible on the chart.
This analysis is purely technical and does not include any fundamental bias.
My method is to identify sentiment, liquidity, and price action (RTM).
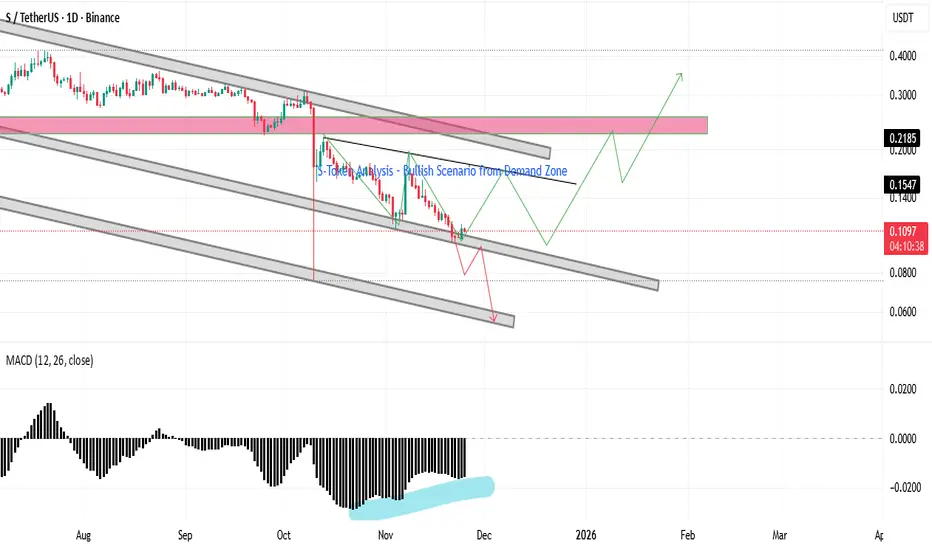
SUSDT swing trade or spot investmentWe can see how the price is moving in the descending channel, currently SUSDT formed a descending wedge figure which may indicate about a reversal movement, another factor is that the price came to the support level of this channel and it seems the price is ready to bounce up from this level, which

SONIC Analysis – Bullish Scenario from Demand ZoneSONIC Technical Analysis – Bullish Scenario
The overall market structure is still moving inside a long-term descending channel, and the price continues to react to both the upper and lower boundaries. Currently, the price has reached a key demand zone as well as the lower boundary of a secondary fal
Sonic Token Tests Key Daily Support at $0.14, Rally Next?Sonic Token recently staged an impulsive rally after establishing solid support around the $0.12 mark, but momentum stalled as price front-ran resistance and corrected back below the Point of Control (POC).
It’s now testing the daily support region near $0.14, which will determine whether bullish

SUSDT Forming Falling WedgeSUSDT is forming a clear falling wedge pattern, a classic bullish reversal signal that often indicates an upcoming breakout in crypto trading pairs like this one. The price has been consolidating within a narrowing range after recent dips to the multi-year support zone around $0.14-$0.16, suggesting

stratiest crypto top gainercompleat higher high
now higher low
Ideal Trading Plan
Step Action Details
1 Wait for EMA20 retest Entry near 0.160–0.165 (EMA20 zone) after pullback
2 Watch RSI If RSI stays above 50 during retest → confirms trend health
3 Confirm candle Look for strong bullish candle off EMA20
4 Enter long Once

S last levels and hope with potential of 31% gain to $0.21Hi
the support and resistances on the chart are based on the previous data and weekly candlesticks if BINANCE:SUSDT holds this last support the potential of 31% gain is logical toward 0.21$

S Analysis (1W)Based on the complete data of this coin | which is not fully available in this chart —
From the point where we placed the red arrow on the chart, the major corrective wave S has begun.
It appears that an ABC pattern has formed on the weekly timeframe, where wave B was a completed diametric structu
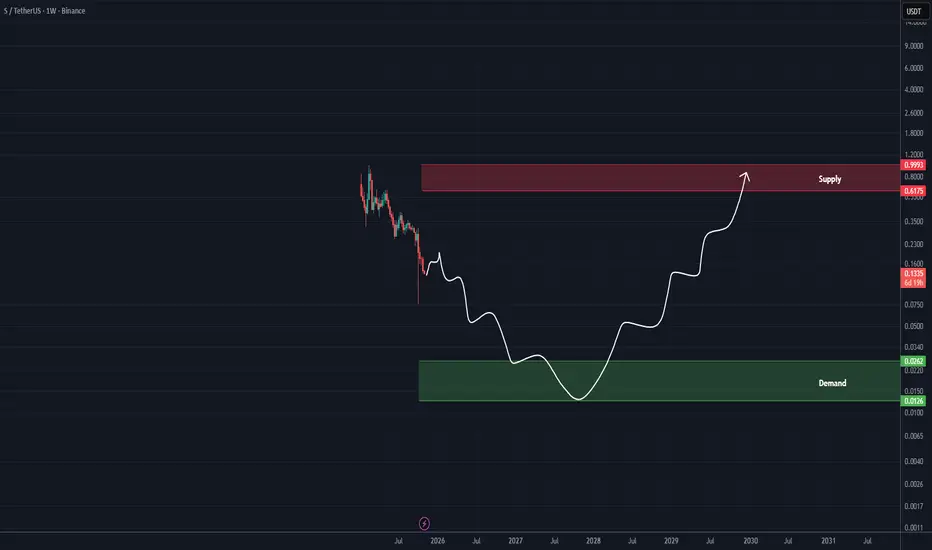
Sonic I think Sonic (S/USDT) is currently sitting at a potential buy zone. The price has reached a strong support area inside a descending channel.
If Bitcoin and Ethereum start their upward movement and break above $124,000 and $5,000 respectively, Sonic could deliver a strong gain, since it has been la

See all ideas
Summarizing what the indicators are suggesting.
Oscillators
Neutral
SellBuy
Strong sellStrong buy
Strong sellSellNeutralBuyStrong buy
Oscillators
Neutral
SellBuy
Strong sellStrong buy
Strong sellSellNeutralBuyStrong buy
Summary
Neutral
SellBuy
Strong sellStrong buy
Strong sellSellNeutralBuyStrong buy
Summary
Neutral
SellBuy
Strong sellStrong buy
Strong sellSellNeutralBuyStrong buy
Summary
Neutral
SellBuy
Strong sellStrong buy
Strong sellSellNeutralBuyStrong buy
Moving Averages
Neutral
SellBuy
Strong sellStrong buy
Strong sellSellNeutralBuyStrong buy
Moving Averages
Neutral
SellBuy
Strong sellStrong buy
Strong sellSellNeutralBuyStrong buy
Frequently Asked Questions
The current price of S / USDT (S) is 0.07965 USDT — it has risen 7.25% in the past 24 hours. Try placing this info into the context by checking out what coins are also gaining and losing at the moment and seeing S price chart.
S / USDT price has fallen by −15.13% over the last week, its month performance shows a −35.24% decrease, and as for the last year, S / USDT has decreased by −89.84%. See more dynamics on S price chart.
Keep track of coins' changes with our Crypto Coins Heatmap.
Keep track of coins' changes with our Crypto Coins Heatmap.
S / USDT (S) reached its highest price on Feb 21, 2025 — it amounted to 0.99000 USDT. Find more insights on the S price chart.
See the list of crypto gainers and choose what best fits your strategy.
See the list of crypto gainers and choose what best fits your strategy.
S / USDT (S) reached the lowest price of 0.07960 USDT on Oct 10, 2025. View more S / USDT dynamics on the price chart.
See the list of crypto losers to find unexpected opportunities.
See the list of crypto losers to find unexpected opportunities.
The safest choice when buying S is to go to a well-known crypto exchange. Some of the popular names are Binance, Coinbase, Kraken. But you'll have to find a reliable broker and create an account first. You can trade S right from TradingView charts — just choose a broker and connect to your account.
Crypto markets are famous for their volatility, so one should study all the available stats before adding crypto assets to their portfolio. Very often it's technical analysis that comes in handy. We prepared technical ratings for S / USDT (S): today its technical analysis shows the sell signal, and according to the 1 week rating S shows the sell signal. And you'd better dig deeper and study 1 month rating too — it's strong sell. Find inspiration in S / USDT trading ideas and keep track of what's moving crypto markets with our crypto news feed.
S / USDT (S) is just as reliable as any other crypto asset — this corner of the world market is highly volatile. Today, for instance, S / USDT is estimated as 0.56% volatile. The only thing it means is that you must prepare and examine all available information before making a decision. And if you're not sure about S / USDT, you can find more inspiration in our curated watchlists.
You can discuss S / USDT (S) with other users in our public chats, Minds or in the comments to Ideas.