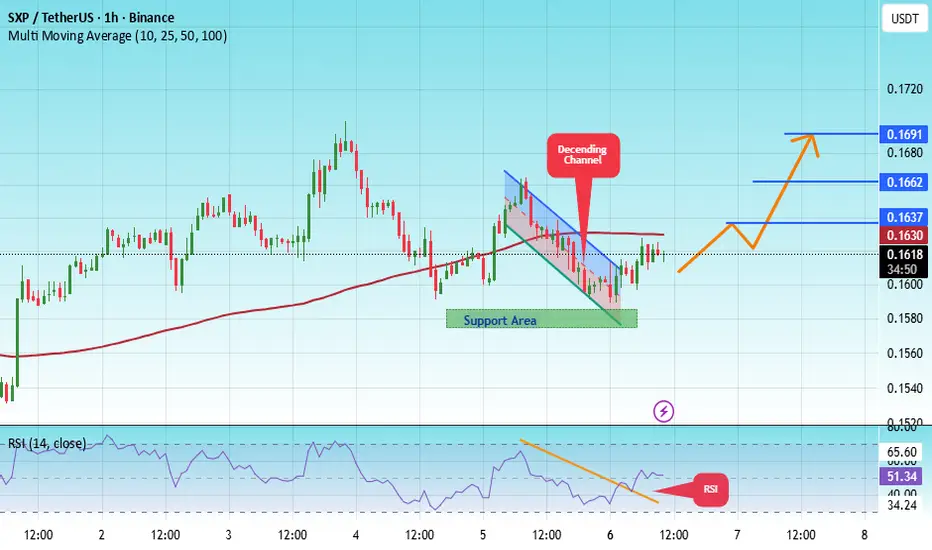
#SXP/USDT looking extremely bullish#SXP
The price is moving in a descending channel on the 1-hour timeframe. It has reached the lower boundary and is heading towards breaking above it, with a retest of the upper boundary expected.
We have a downtrend on the RSI indicator, which has reached near the lower boundary, and an upward reb

#SXP/USDT looking extremely bullish#SXP
The price is moving within an ascending channel on the 1-hour timeframe and is adhering to it well. It is poised to break out strongly and retest the channel.
We have a downtrend line on the RSI indicator that is about to break and retest, which supports the upward move.
There is a key suppo

SXPUSDT Forming Falling WedgeSXP/USDT appears to be forming a classic falling wedge pattern—one that’s showing increased volume and heightened interest from the investing community. The narrowing range and converging trendlines hint at a compression of volatility, which often precedes a breakout to the upside. Given the current
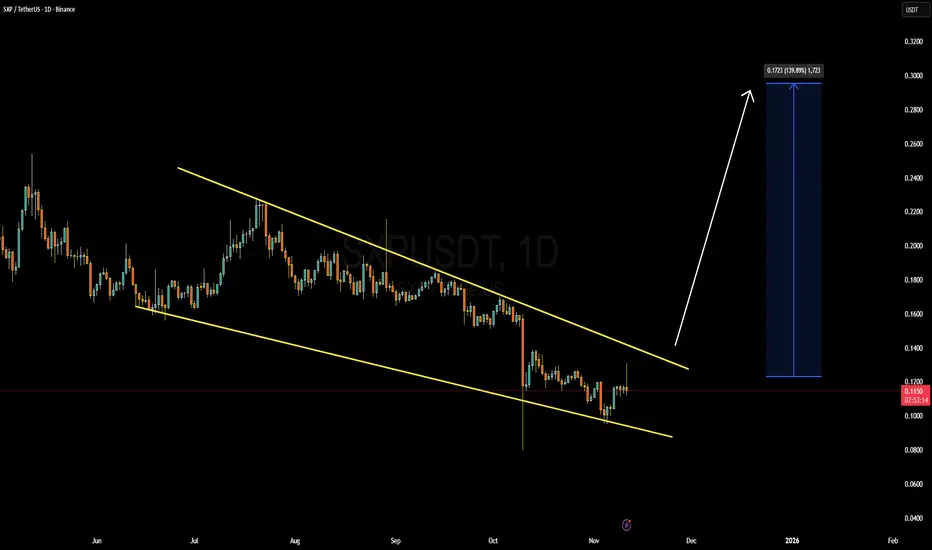
SXPUSDT 1D#SXP is moving inside a falling wedge pattern on the daily chart. Consider buying a small bag here and near the support shown on the chart. In case of a breakout above the wedge resistance, the potential targets are:
🎯 $0.1597
🎯 $0.1995
🎯 $0.2317
🎯 $0.2639
🎯 $0.3097
🎯 $0.3680
⚠️ Always use a tight

Scalp Long – SXP💎 Scalp Long – SXP
Price has broken out of the descending channel and completed its retest successfully. RSI is in the buying zone, while buying volume continues to rise sharply, confirming bullish momentum.
🎯 Trade Setup:
→ TP: 0.1108 | SL: 0.098 | RR: 1 : 3.13
Structure, momentum, and volume ar

Scalp Long – SXP💎 Scalp Long – SXP
RSI is in the buying zone, and price has broken out of the short-term downtrend, confirming a shift in momentum.
Buying volume is increasing across lower timeframes, reinforcing bullish sentiment.
🎯 Plan:
→ Enter after confirmation of breakout strength.
→ TP: 0.1168 | SL: 0.1057

Scalp Long – SXP💎 Scalp Long – SXP
RSI has broken out from the corrective trend and is now in the strong buy zone.
Price shows strong bullish momentum, breaking through major resistance.
Buying volume is returning, confirming renewed market strength.
The move continues toward testing the local high.
🎯 Plan:
→ Ent

#SXP/USDT looking extremely bullish#SXP
The price is moving within a descending channel on the 1-hour frame, adhering well to it, and is heading for a strong breakout and retest.
We have a bearish trend on the RSI indicator that is about to be broken and retested, which supports the upward breakout.
There is a major support area i

#SXP/USDT looking extremely bullish #SXP
The price is moving within a descending channel on the 1-hour frame, adhering well to it, and is heading for a strong breakout and retest.
We have a bearish trend on the RSI indicator that is about to be broken and retested, which supports the upward breakout.
There is a major support area i
See all ideas
Summarizing what the indicators are suggesting.
Oscillators
Neutral
SellBuy
Strong sellStrong buy
Strong sellSellNeutralBuyStrong buy
Oscillators
Neutral
SellBuy
Strong sellStrong buy
Strong sellSellNeutralBuyStrong buy
Summary
Neutral
SellBuy
Strong sellStrong buy
Strong sellSellNeutralBuyStrong buy
Summary
Neutral
SellBuy
Strong sellStrong buy
Strong sellSellNeutralBuyStrong buy
Summary
Neutral
SellBuy
Strong sellStrong buy
Strong sellSellNeutralBuyStrong buy
Moving Averages
Neutral
SellBuy
Strong sellStrong buy
Strong sellSellNeutralBuyStrong buy
Moving Averages
Neutral
SellBuy
Strong sellStrong buy
Strong sellSellNeutralBuyStrong buy
Displays a symbol's price movements over previous years to identify recurring trends.