#SYS/USDT looks very bullish#SYS
The price is moving in a descending channel on the 1-hour timeframe. It has reached the lower boundary and is heading towards breaking above it, with a retest of the upper boundary expected.
We have a downtrend on the RSI indicator, which has reached near the lower boundary, and an upward reb
Related pairs

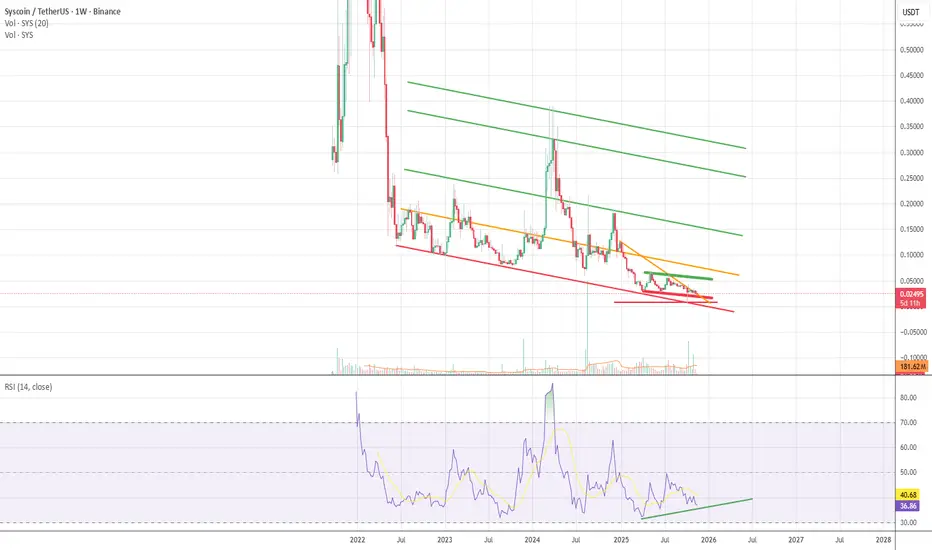
SYS Short Term Goals Still Apply🔵 SYSUSDT Long-Term Cycle Projection (Macro View)
1) Current Structure
SYS is sitting at the bottom of a multi-year descending channel.
Price is tapping long-term support while the RSI forms a clear bullish divergence
on the higher timeframes.
This is typically a bottoming pattern seen before ne
#SYS/USDT looks very bullish#SYS
The price is moving within an ascending channel on the 1-hour timeframe and is adhering to it well. It is poised to break out strongly and retest the channel.
We have a downtrend line on the RSI indicator that is about to break and retest, which supports the upward move.
There is a key suppo

#SYS/USDT looks very bullish#SYS
The price is moving within an ascending channel on the 1-hour frame, adhering well to it, and is poised to break it strongly upwards and retest it.
We have support from the lower boundary of the ascending channel, at 0.04060.
We have a downtrend on the RSI indicator that is about to break an

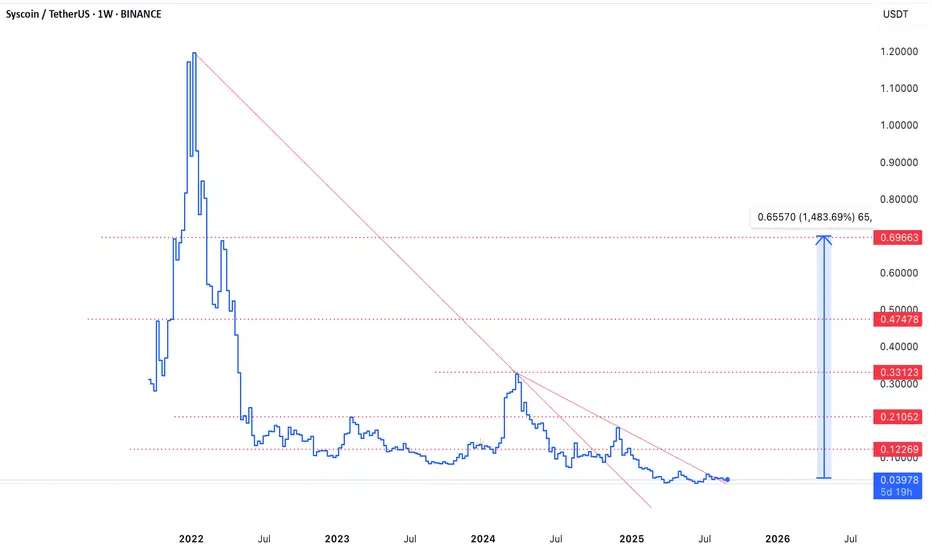
SYSUSDT idea - Bullish short/mid/long termThere’s quite a lot happening around Syscoin (SYS) lately, but from a trading perspective, I see strong potential for a 5x move by year-end, considering its relatively small market cap.
SYS aligns with several current market narratives — masternodes, zk-proofs, privacy, and “dino coin” appeal — whi

SYSUSDT 1D#SYS is moving inside a falling wedge pattern on the daily chart.
If you’re willing to take a small risk, consider buying a small bag near the support level of $0.02510.
Keep in mind that the market is still under the influence of Bitcoin’s drop, so don’t be greedy and manage your entries wisely.
I

SYS — Perfect Retest & Dino Season Vibes Perfect retest of the red line at 0.006 (the recent flash crash level).
Next target zone is the orange line around 0.06–0.08.
After that brutal liquidation crash, price dipped deep — but SYS could be one of the few to turn it into an opportunity. Recent narratives around privacy coins (like ZCASH a

SYS - Awaiting the BreakoutDear my friends,
Looking at the weekly chart of SYS, it is clear that the price has broken out of the downtrend.
Reviewing the volume in August 2024, a strong green volume bar appeared. However, the price only managed to break the downtrend and then entered a period of accumulation and retest. At t
SYSUSDT.PSetup has been marked on the chart.
Dont enter without confirmation.
We are here for trading not FOMO and enter.
Market always gives us the chance every other day. So, if we gonna miss this we will catch other. But we will long it with confirmation ONLY..
When chart looks easy " its a trap " so

#SYS/USDT#SYS
The price is moving within a descending channel on the 1-hour frame and is expected to break and continue upward.
We have a trend to stabilize above the 100 moving average once again.
We have a downtrend on the RSI indicator, which supports the upward move by breaking it upward.
We have a s

See all ideas
Summarizing what the indicators are suggesting.
Oscillators
Neutral
SellBuy
Strong sellStrong buy
Strong sellSellNeutralBuyStrong buy
Oscillators
Neutral
SellBuy
Strong sellStrong buy
Strong sellSellNeutralBuyStrong buy
Summary
Neutral
SellBuy
Strong sellStrong buy
Strong sellSellNeutralBuyStrong buy
Summary
Neutral
SellBuy
Strong sellStrong buy
Strong sellSellNeutralBuyStrong buy
Summary
Neutral
SellBuy
Strong sellStrong buy
Strong sellSellNeutralBuyStrong buy
Moving Averages
Neutral
SellBuy
Strong sellStrong buy
Strong sellSellNeutralBuyStrong buy
Moving Averages
Neutral
SellBuy
Strong sellStrong buy
Strong sellSellNeutralBuyStrong buy
Displays a symbol's price movements over previous years to identify recurring trends.
Frequently Asked Questions
The current price of SYSUSDT SPOT (SYS) is 0.01732 USDT — it has fallen −3.63% in the past 24 hours. Try placing this info into the context by checking out what coins are also gaining and losing at the moment and seeing SYS price chart.
SYSUSDT SPOT price has fallen by −14.65% over the last week, its month performance shows a −31.08% decrease, and as for the last year, SYSUSDT SPOT has decreased by −88.38%. See more dynamics on SYS price chart.
Keep track of coins' changes with our Crypto Coins Heatmap.
Keep track of coins' changes with our Crypto Coins Heatmap.
SYSUSDT SPOT (SYS) reached its highest price on Mar 11, 2024 — it amounted to 0.38800 USDT. Find more insights on the SYS price chart.
See the list of crypto gainers and choose what best fits your strategy.
See the list of crypto gainers and choose what best fits your strategy.
SYSUSDT SPOT (SYS) reached the lowest price of 0.01501 USDT on Oct 10, 2025. View more SYSUSDT SPOT dynamics on the price chart.
See the list of crypto losers to find unexpected opportunities.
See the list of crypto losers to find unexpected opportunities.
The safest choice when buying SYS is to go to a well-known crypto exchange. Some of the popular names are Binance, Coinbase, Kraken. But you'll have to find a reliable broker and create an account first. You can trade SYS right from TradingView charts — just choose a broker and connect to your account.
Crypto markets are famous for their volatility, so one should study all the available stats before adding crypto assets to their portfolio. Very often it's technical analysis that comes in handy. We prepared technical ratings for SYSUSDT SPOT (SYS): today its technical analysis shows the sell signal, and according to the 1 week rating SYS shows the sell signal. And you'd better dig deeper and study 1 month rating too — it's strong sell. Find inspiration in SYSUSDT SPOT trading ideas and keep track of what's moving crypto markets with our crypto news feed.
SYSUSDT SPOT (SYS) is just as reliable as any other crypto asset — this corner of the world market is highly volatile. Today, for instance, SYSUSDT SPOT is estimated as 2.80% volatile. The only thing it means is that you must prepare and examine all available information before making a decision. And if you're not sure about SYSUSDT SPOT, you can find more inspiration in our curated watchlists.
You can discuss SYSUSDT SPOT (SYS) with other users in our public chats, Minds or in the comments to Ideas.