TLM Impulsive Move Followed by Demand RetestTLM printed a strong impulsive breakout after a long consolidation phase, creating a clear displacement to the upside. Following this move, price entered a corrective phase and is now pulling back toward a well-defined demand zone formed between the Fibonacci retracement levels.
This zone represents a healthy retracement area rather than immediate weakness. As long as price holds above this demand region and shows stabilization, continuation toward higher resistance levels remains possible, including a retest of the recent highs and extension toward the upper resistance around zero point zero zero four.
If price fails to hold this demand zone, the correction could deepen toward the lower support levels below zero point zero two one, invalidating the bullish continuation scenario.
This setup is based on impulse–retracement structure, demand reaction behavior, and Fibonacci confluence. Confirmation from this zone will define the next directional move.
Market insights

TLMUSDT 1D#TLM is trading within a descending triangle on the daily chart. In case of a breakout above the triangle resistance and the daily SMA200, the potential targets are:
🎯 $0.00577
🎯 $0.00706
🎯 $0.00811
🎯 $0.00916
🎯 $0.01064
⚠️ Always remember to use a tight stop-loss and maintain proper risk management.

TLM analysis:Price is encountering significant resistance at the downtrend line, and the bullish trend will be confirmed following a breakout. We will initiate a new long position if the price remains above the $0.0055 level. The downside support is around the $0.0045 level.
TLM GROK: Since no specific asset or market data is provided in your request, I’ll walk through a general analysis and prediction process based on a hypothetical scenario involving a stock trade, putting myself in your shoes to ensure clarity. Let’s assume we’re analyzing a tech stock, XYZ Corp, based on its recent performance trends as of August 31, 2025.

tlm target final🔹 TLM Price 0.0046 → 0.15 USD
Stage Price Range (USD) Description
1 0.0045 – 0.0050 Short-term consolidation, liquidity accumulation
2 0.0050 – 0.0070 Initial breakout, attracting early buyers
3 0.0070 – 0.0100 Mid-term resistance, monitor volume and trend
4 0.0100 – 0.0200 Strong bullish zone, potential entry for long-term investors
5 0.0200 – 0.0500 Accelerated growth, wider market adoption and hype
6 0.0500 – 0.1000 Major bullish trend, strong fundamentals required
7 0.1000 – 0.1500 Long-term target, high risk/high reward zone
---
🔹 Key Notes
Risk Level: Extremely high — this target is very ambitious and long-term.
Entry Zones: Best to enter gradually from stage 1–4 to manage risk.
Stop-Loss: Keep protective stop-loss below recent support levels (e.g., 0.0045 USD).
Indicators: Watch RSI, EMA9/21, VWAP, and trading volume for

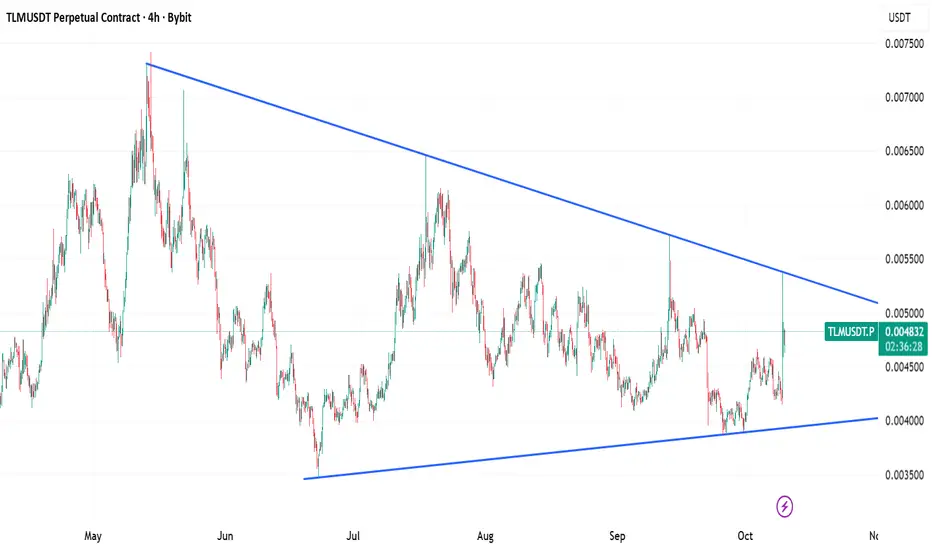
TLM Ready for Breakout or Breakdown?Yello Paradisers, are you ready for what could be the final squeeze before TLM makes its next big move? After weeks of bleeding inside this descending channel, the price is now pressing hard against the upper boundary and a decision is coming fast.
💎#TLMUSDT has bounced from a clear support zone around $0.00470 and is currently showing bullish signs with a confirmed break of structure. But for any continuation to the upside, we must see a clean breakout above the descending resistance now acting as the barrier around the $0.0049–$0.0050 area. If that happens, there’s a clear path toward the minor resistance at $0.0056, and potentially a full swing toward the strong resistance zone near $0.0062.
💎However, if #TLM gets rejected here, the price is likely to revisit support, and any break below $0.0042 would invalidate the current bullish setup and confirm weakness returning to the market.This is not the time to trade emotionally. The chart is giving us a clear structure and until the breakout is confirmed, anything else is just noise.
Stay focused, wait for the confirmation, and trade like a pro.
MyCryptoParadise
iFeel the success🌴

Tlm 10X soonAlien Worlds
Alien Worlds is an NFT metaverse running on the Ethereum, Binance Smart Chain and WAX blockchains
Long-running trend breakout
Time to fly
I wish everyone abundant profits.
Like and follow
for more.
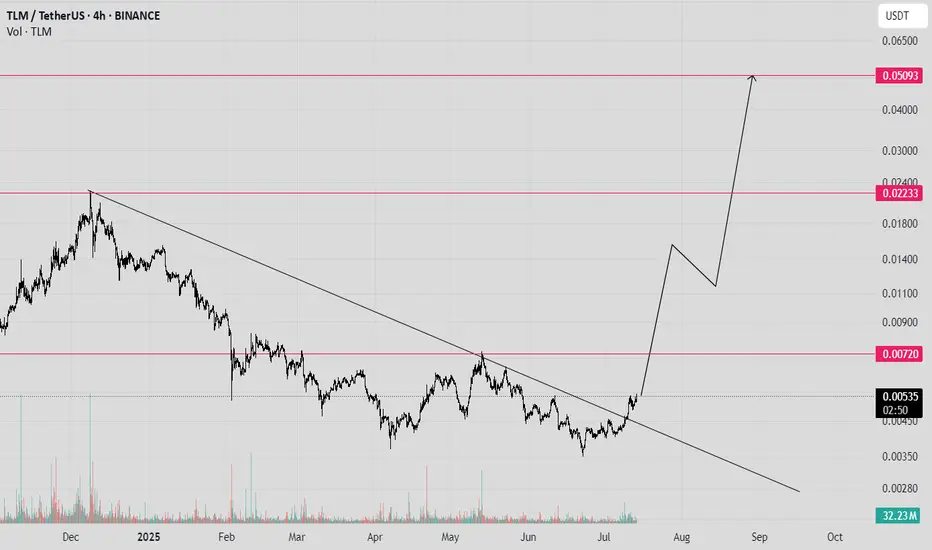
TLM 2800% SoonAlien Worlds
TLM
"Alien Worlds is an NFT metaverse running on the Ethereum, Binance Smart Chain and WAX blockchains."
A sleeping giant
It didn't get its chance because it was listed at the end of the previous bull market.
It's been in a downtrend for over a year.
The day before yesterday, this damned trend was broken.
I expect a very strong rise in the near future.
Targets on the chart:
Stop breaking the bottom and trading below it.
I wish everyone abundant profits.
Like and follow
for more.
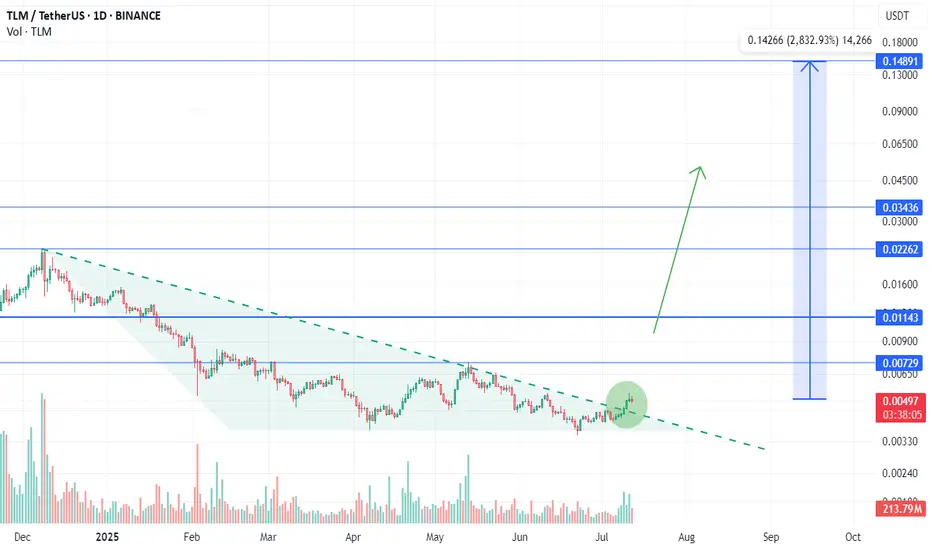
TLMUSDT 1D AnalysisTLM ~ 1D Analysis
#TLM This trade is very high risk, buy from here if you still have confidence in this coin with a short term target of at least 15%++

$TLM GOING TO MORE ZEROSIt's going to more zeros.
I warned you before that TLM is adding more zeros. Do not go towards such assets, do not buy them, do not hold them.

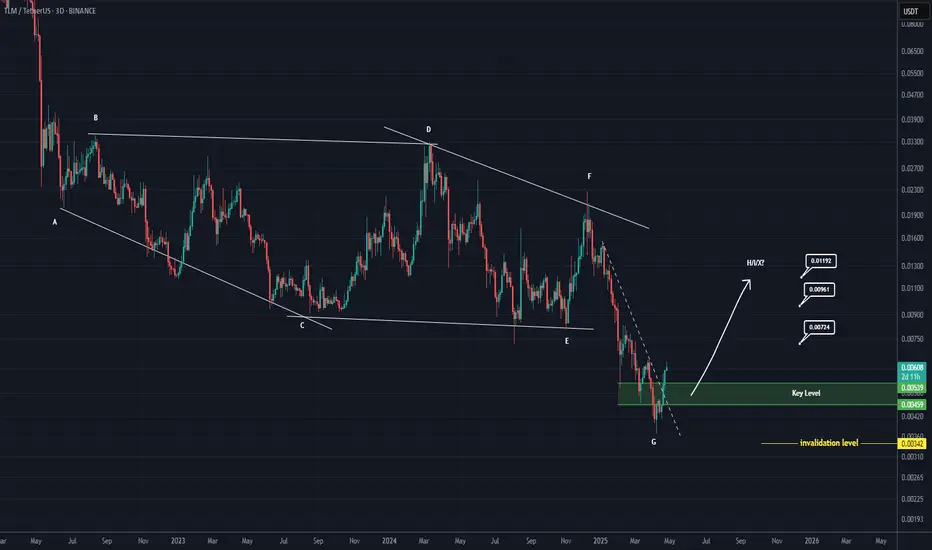
TLM Looks Bullish (3D)It seems that a diametric has completed on the chart, or Wave G of a symmetrical pattern has ended, or the price is attempting to form a bullish X-wave.
There is a key zone on the chart that the price has reclaimed, marked in green.
As long as this zone holds, the price can move toward the targets, which are highlighted on the chart.
A daily candle closing below the invalidation level would invalidate this analysis.
For risk management, please don't forget stop loss and capital management
When we reach the first target, save some profit and then change the stop to entry
Comment if you have any questions
Thank You
TLM Bearish Flag Formation – Short Opportunity Ahead?#TLM is currently forming a Bearish Flag pattern on the 4H timeframe – a classic continuation setup indicating potential downside.
🔍 Key Observations:
Price is consolidating within the golden zone of the Fibonacci retracement.
We're closely watching for confirmation signals before entering a short position.
📉 Bearish Confirmation Triggers:
Bearish Divergence on RSI
Break of Support Level (flag support line)
Break & Retest of the 0.5 Fib level
⚠️ The more confirmations we get, the stronger the case for a bearish move. Patience is key – wait for the setup to mature and always use proper risk management. 🛡️
📌 Plan: Enter short after confirmation of at least one major bearish sign. Look for confluence to increase trade reliability.
💬 Let me know what you think! Are you shorting #TLM? Drop your analysis or charts below 👇
#TLM #CryptoAnalysis #BearishFlag #TechnicalAnalysis #ShortTrade #4HChart #Fibonacci #TradingView

Excited to see friends who are interested in cryptoBINANCE:TLMUSDT
"Today, I'm sharing a bit about a crypto idea that I've bought specifically for a position hold, within a timeframe of 3 days to 3 months."

TLMUSDT 1DTLM ~ 1D Analysis
#TLM This resistant line broken will confirm sustainable bullish. with a short -term target of at least 10%+.

TLMUSDT | Volume Explosion with Momentum, But Caution is KeyTLMUSDT has seen a remarkable volume explosion today, showing a serious influx of buyers that’s turning heads across the market. This kind of activity doesn’t go unnoticed. But as always, we don’t just get excited and enter randomly. We read the structure, and we react with purpose.
🟠 Key Zone to Watch:
The orange box below is acting as the support of this aggressive move. As long as the price holds above it and shows healthy structure or accumulation signs around that level, continuation to the upside is absolutely possible. For those considering long positions, this is the area to keep an eye on. But don’t forget, confirmation is non-negotiable. Without confirmation on the lower time frames, this could easily turn into a trap.
📌 Things to Keep in Mind:
The volume spike today isn’t just big, it’s extraordinary. This often points to institutional activity or aggressive large players entering. But sometimes, these spikes are the final effort before a reversal. That’s why we stay sharp. If the price breaks below the orange box, this bullish momentum could fade fast and sellers might take over.
💬 Why My Followers Never Miss the Real Moves:
People trust my levels because they consistently deliver. I don't base my decisions on guesses or hope. I watch how price interacts with key zones, and I only act when the market speaks clearly. That's the reason my audience keeps growing, and why so many depend on these analyses every day. If you want to stay a step ahead and avoid the noise, following this page is your smartest move.
This could be a real opportunity, but success comes from discipline. Be patient, wait for the market to confirm, and let’s keep winning together.
📌I keep my charts clean and simple because I believe clarity leads to better decisions.
📌My approach is built on years of experience and a solid track record. I don’t claim to know it all but I’m confident in my ability to spot high-probability setups.
📌If you would like to learn how to use the heatmap, cumulative volume delta and volume footprint techniques that I use below to determine very accurate demand regions, you can send me a private message. I help anyone who wants it completely free of charge.
🔑I have a long list of my proven technique below:
🎯 ZENUSDT.P: Patience & Profitability | %230 Reaction from the Sniper Entry
🐶 DOGEUSDT.P: Next Move
🎨 RENDERUSDT.P: Opportunity of the Month
💎 ETHUSDT.P: Where to Retrace
🟢 BNBUSDT.P: Potential Surge
📊 BTC Dominance: Reaction Zone
🌊 WAVESUSDT.P: Demand Zone Potential
🟣 UNIUSDT.P: Long-Term Trade
🔵 XRPUSDT.P: Entry Zones
🔗 LINKUSDT.P: Follow The River
📈 BTCUSDT.P: Two Key Demand Zones
🟩 POLUSDT: Bullish Momentum
🌟 PENDLEUSDT.P: Where Opportunity Meets Precision
🔥 BTCUSDT.P: Liquidation of Highly Leveraged Longs
🌊 SOLUSDT.P: SOL's Dip - Your Opportunity
🐸 1000PEPEUSDT.P: Prime Bounce Zone Unlocked
🚀 ETHUSDT.P: Set to Explode - Don't Miss This Game Changer
🤖 IQUSDT: Smart Plan
⚡️ PONDUSDT: A Trade Not Taken Is Better Than a Losing One
💼 STMXUSDT: 2 Buying Areas
🐢 TURBOUSDT: Buy Zones and Buyer Presence
🌍 ICPUSDT.P: Massive Upside Potential | Check the Trade Update For Seeing Results
🟠 IDEXUSDT: Spot Buy Area | %26 Profit if You Trade with MSB
📌 USUALUSDT: Buyers Are Active + %70 Profit in Total
🌟 FORTHUSDT: Sniper Entry +%26 Reaction
🐳 QKCUSDT: Sniper Entry +%57 Reaction
📊 BTC.D: Retest of Key Area Highly Likely
📊 XNOUSDT %80 Reaction with a Simple Blue Box!
📊 BELUSDT Amazing %120 Reaction!
I stopped adding to the list because it's kinda tiring to add 5-10 charts in every move but you can check my profile and see that it goes on..

TLMUSDT – Watch Out! Strong Resistance AheadThe red box on TLMUSDT is a significant resistance zone, packed with a lot of sellers. This could be a tough area for price to break through, so you need to be extra cautious here.
🔴 Key Takeaways:
Strong Resistance: The red box represents a high seller concentration, which means there’s significant pressure on the price at this level.
Approach with Caution: I highly recommend waiting for lower timeframe (LTF) confirmations, and don’t forget to check the CDV (Cumulative Delta Volume) and volume footprint for further validation before making any moves.
Patience and Precision: Trading without confirmation here is risky, so take the time to assess whether the price will truly break through this resistance or if it will get rejected.
⚡ Remember: Be disciplined and only enter when the signals align. Don’t rush—wait for the perfect confirmation before taking any action.
📌I keep my charts clean and simple because I believe clarity leads to better decisions.
📌My approach is built on years of experience and a solid track record. I don’t claim to know it all but I’m confident in my ability to spot high-probability setups.
📌If you would like to learn how to use the heatmap, cumulative volume delta and volume footprint techniques that I use below to determine very accurate demand regions, you can send me a private message. I help anyone who wants it completely free of charge.
🔑I have a long list of my proven technique below:
🎯 ZENUSDT.P: Patience & Profitability | %230 Reaction from the Sniper Entry
🐶 DOGEUSDT.P: Next Move
🎨 RENDERUSDT.P: Opportunity of the Month
💎 ETHUSDT.P: Where to Retrace
🟢 BNBUSDT.P: Potential Surge
📊 BTC Dominance: Reaction Zone
🌊 WAVESUSDT.P: Demand Zone Potential
🟣 UNIUSDT.P: Long-Term Trade
🔵 XRPUSDT.P: Entry Zones
🔗 LINKUSDT.P: Follow The River
📈 BTCUSDT.P: Two Key Demand Zones
🟩 POLUSDT: Bullish Momentum
🌟 PENDLEUSDT.P: Where Opportunity Meets Precision
🔥 BTCUSDT.P: Liquidation of Highly Leveraged Longs
🌊 SOLUSDT.P: SOL's Dip - Your Opportunity
🐸 1000PEPEUSDT.P: Prime Bounce Zone Unlocked
🚀 ETHUSDT.P: Set to Explode - Don't Miss This Game Changer
🤖 IQUSDT: Smart Plan
⚡️ PONDUSDT: A Trade Not Taken Is Better Than a Losing One
💼 STMXUSDT: 2 Buying Areas
🐢 TURBOUSDT: Buy Zones and Buyer Presence
🌍 ICPUSDT.P: Massive Upside Potential | Check the Trade Update For Seeing Results
🟠 IDEXUSDT: Spot Buy Area | %26 Profit if You Trade with MSB
📌 USUALUSDT: Buyers Are Active + %70 Profit in Total
🌟 FORTHUSDT: Sniper Entry +%26 Reaction
🐳 QKCUSDT: Sniper Entry +%57 Reaction
📊 BTC.D: Retest of Key Area Highly Likely
📊 XNOUSDT %80 Reaction with a Simple Blue Box!
📊 BELUSDT Amazing %120 Reaction!
I stopped adding to the list because it's kinda tiring to add 5-10 charts in every move but you can check my profile and see that it goes on..

TLM/USDThello friends
This currency is expected to move to the support range according to the structure that is formed.
If the range is maintained, we can see the structure change and price growth.
*Trade safely with us*

Analysis and review of TLM: Is it time to buy? Read the caption.hello friends
You can see that the price has started to fall after a strong movement to resistance and after falling, it is placed in a descending channel, which made the bottom of the channel a classic pattern for us.
Now we can enter the transaction with the successful channel failure.
And at least put ourselves under the last floor.
*Trade safely with us*

#TLM (SPOT-INVEST) IN( 0.00820- 0.00950) T.(0.11500) SL(0.00818)BINANCE:TLMUSDT
#TLM / USDT
Entry ( 0.00820- 0.00950)
SL 3D close below 0.00818
T1 0.02200
T2 0.05000
T3 0.06600
T4 0.08300
T5 0.11500
3 Extra Targets(optional) in chart, if you like to continue in the trade with making stoploss very high.
______________________________________________________________
Golden Advices.
********************
* collect the coin slowly in the entry range.
* Please calculate your losses before the entry.
* Do not enter any trade you find it not suitable for you.
* No FOMO - No Rush , it is a long journey.
Useful Tags.
****************
My total posts
www.tradingview.com
**********************************************************************************************
#Manta #OMNI #DYM #AI #IO #XAI #ACE #NFP #RAD #WLD #ORDI #BLUR #SUI #VOXEL #AEVO #VITE #APE #RDNT #FLUX #NMR #VANRY #TRB #HBAR #DGB #XEC #ERN #ALT #IO #ACA #HIVE #ASTR #ARDR #PIXEL #LTO #AERGO #SCRT #ATA #HOOK #FLOW #KSM #HFT #MINA #DATA #SC #JOE #RDNT #IQ #CFX #BICO #CTSI #KMD #FXS #DEGO #FORTH #AST #PORTAL #CYBER #RIF #ENJ #ZIL #APT #GALA #STEEM #ONE #LINK #NTRN #COTI #RENDER #ICX #IMX #ALICE #PYR #PORTAL #GRT #GMT #IDEX #NEAR #ICP #ETH #QTUM #VET #QNT #API3 #BURGER #MOVR #SKL #BAND #ETHFI #SAND #IOTX #T #GTC #PDA #GMX #REZ #DUSK #BNX #SPELL #POWR #JOE #TIA #TFUEL #HOT #AVAX #WAXP #OGN #AXS #GALA #ONE #SYS #SCRT #DGB #LIT #QI #FIL #GLMR #ATOM #LTC #MANA #ONT #TLM

#TLM (SPOT) IN ( 0.01050- 0.01250) T.(0.11500) SL(0.01012)BINANCE:TLMUSDT
#TLM / USDT
Entry ( 0.01050- 0.01250)
SL 1D close below 0.01012
T1 0.02200
T2 0.05000
T3 0.06600
T4 0.08300
T5 0.11500
3 Extra Targets(optional) in chart, if you like to continue in the trade with making stoploss very high.
______________________________________________________________
Golden Advices.
********************
* collect the coin slowly in the entry range.
* Please calculate your losses before the entry.
* Do not enter any trade you find it not suitable for you.
* No FOMO - No Rush , it is a long journey.
Useful Tags.
****************
My total posts
www.tradingview.com
**********************************************************************************************
#Manta #OMNI #DYM #AI #IO #XAI #ACE #NFP #RAD #WLD #ORDI #BLUR #SUI #VOXEL #AEVO #VITE #APE #RDNT #FLUX #NMR #VANRY #TRB #HBAR #DGB #XEC #ERN #ALT #IO #ACA #HIVE #ASTR #ARDR #PIXEL #LTO #AERGO #SCRT #ATA #HOOK #FLOW #KSM #HFT #MINA #DATA #SC #JOE #RDNT #IQ #CFX #BICO #CTSI #KMD #FXS #DEGO #FORTH #AST #PORTAL #CYBER #RIF #ENJ #ZIL #APT #GALA #STEEM #ONE #LINK #NTRN #COTI #RENDER #ICX #IMX #ALICE #PYR #PORTAL #GRT #GMT #IDEX #NEAR #ICP #ETH #QTUM #VET #QNT #API3 #BURGER #MOVR #SKL #BAND #ETHFI #SAND #IOTX #T #GTC #PDA #GMX #REZ #DUSK #BNX #SPELL #POWR #JOE #TIA #TFUEL #HOT #AVAX #WAXP #OGN #AXS #GALA #ONE #SYS #SCRT #DGB #LIT #QI #FIL #GLMR #ATOM #LTC #MANA #ONT
#TLM

TLMUSDT 1WTLM ~ 1W Analysis
#TLM At Time Frame 1W this is the lowest support block for now. If you still have Conviction on this coin, buy it from here with a target of 20%++

TLMUSDT Surges with 100% Daily Volume Spike – Breakout Incoming?TLMUSDT Analysis
Key Breakout Zone and a Bullish Plan
"TLMUSDT is heating up with a 100% daily volume increase. This isn’t just a random spike; it’s the kind of setup that gets traders excited."
The Game Plan:
Red Box Breakout: If we see a breakout above the red box as I’ve described in the chart, I’ll be waiting for the retest – targeting the value zone near the last swing low for a bullish entry.
Great Levels: Let’s be honest, these aren’t bad levels to work with. When the market aligns, these zones can deliver solid reactions.
Key Observations:
"As always, my tools are ready: CDV, volume profile, and liquidity heatmap. Look for confirmation with a strong market structure break on lower time frames before entering."
This could be a textbook setup. Stay sharp, trade with purpose, and ride the momentum! 🚀
Let me tell you, this is something special. These insights, these setups—they’re not just good; they’re game-changers. I've spent years refining my approach, and the results speak for themselves. People are always asking, "How do you spot these opportunities?" It’s simple: experience, clarity, and a focus on high-probability moves.
Want to know how I use heatmaps, cumulative volume delta, and volume footprint techniques to find demand zones with precision? I’m happy to share—just send me a message. No cost, no catch. I believe in helping people make smarter decisions.
Here are some of my recent analyses. Each one highlights key opportunities:
🚀 RENDERUSDT: Strategic Support Zones at the Blue Boxes +%45 Reaction
🎯 PUNDIXUSDT: Huge Opportunity | 250% Volume Spike - %60 Reaction Sniper Entry
🌐 CryptoMarkets TOTAL2: Support Zone
🚀 GMTUSDT: %35 FAST REJECTION FROM THE RED BOX
🎯 ZENUSDT.P: Patience & Profitability | %230 Reaction from the Sniper Entry
🎯 DEXEUSDT %180 Reaction with %9 Stop
🐶 DOGEUSDT.P: Next Move
🎨 RENDERUSDT.P: Opportunity of the Month
💎 ETHUSDT.P: Where to Retrace
🟢 BNBUSDT.P: Potential Surge
📊 BTC Dominance: Reaction Zone
🌊 WAVESUSDT.P: Demand Zone Potential
🟣 UNIUSDT.P: Long-Term Trade
🔵 XRPUSDT.P: Entry Zones
🔗 LINKUSDT.P: Follow The River
📈 BTCUSDT.P: Two Key Demand Zones
🟩 POLUSDT: Bullish Momentum
🌟 PENDLEUSDT.P: Where Opportunity Meets Precision
🔥 BTCUSDT.P: Liquidation of Highly Leveraged Longs
🌊 SOLUSDT.P: SOL's Dip - Your Opportunity
🐸 1000PEPEUSDT.P: Prime Bounce Zone Unlocked
🚀 ETHUSDT.P: Set to Explode - Don't Miss This Game Changer
🤖 IQUSDT: Smart Plan
⚡️ PONDUSDT: A Trade Not Taken Is Better Than a Losing One
💼 STMXUSDT: 2 Buying Areas
🐢 TURBOUSDT: Buy Zones and Buyer Presence
🌍 ICPUSDT.P: Massive Upside Potential | Check the Trade Update For Seeing Results
🟠 IDEXUSDT: Spot Buy Area | %26 Profit if You Trade with MSB
📌 USUALUSDT: Buyers Are Active + %70 Profit in Total
🌟 FORTHUSDT: Sniper Entry +%26 Reaction
🐳 QKCUSDT: Sniper Entry +%57 Reaction
📊 BTC.D: Retest of Key Area Highly Likely
This list? It’s just a small piece of what I’ve been working on. There’s so much more. Go check my profile, see the results for yourself. My goal is simple: provide value and help you win. If you’ve got questions, I’ve got answers. Let’s get to work!

TLMUSDT 1WTLM ~ 1W
#TLM If you still have Conviction on the coin,. Purchase gradually within this support block. with a minimum target of 20%+
