Tokenusdt bottomed outTokenUSDT has continued its downtrend but shows signs of a potential reversal after a sharp decline towards the $0.0043 demand zone. The price has bounced from this level, indicating strong buyer interest. Look for re-accumulation around the current bounce zone and aim for the projected upside targets as outlined on the chart. Place a stop loss below the most recent low (presumably below the $0.0043 bounce level) to protect against the downtrend resuming.
Market insights
TOKENUSDT — This the Start of Accumulation or Anothe Breakdown?Full Analysis
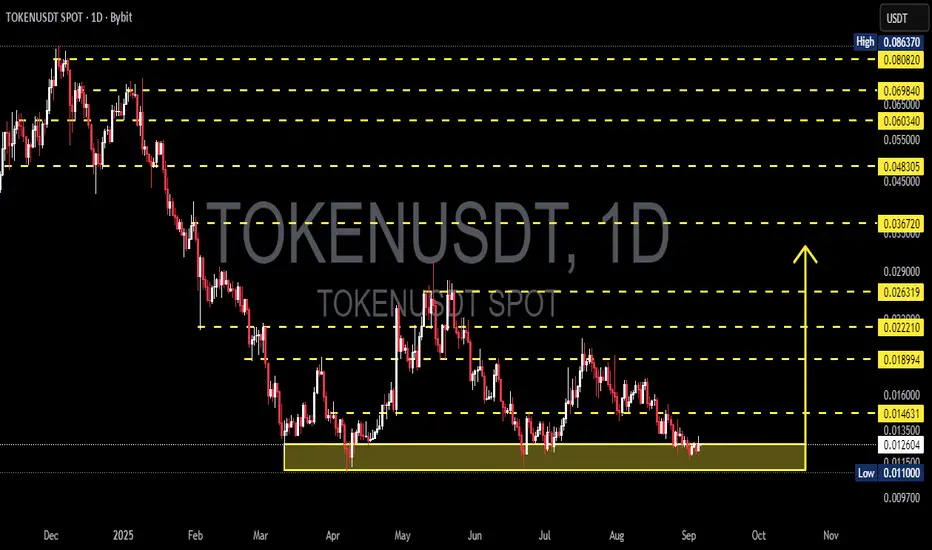
TOKENUSDT is now trading at a decisive area: the major support zone between 0.0110 – 0.0146 USDT (highlighted in yellow). This zone has been tested multiple times since March 2025, making it a crucial demand area. How price reacts here will define the next big move: either a strong rebound or a deep continuation of the downtrend.
Market Structure
Primary trend: still bearish since the peak near 0.086 USDT (early 2025).
Lower highs sequence: sellers remain in control.
Multi-touch support: shows strong tug-of-war between buyers and sellers.
If this support holds, a potential triple bottom / accumulation base could form. But if it breaks, expect further downside.
---
Bullish Scenario 🟢
Confirmation: Daily close above 0.01463 USDT with strong volume.
Potential pattern: Base formation → higher low structure.
Upside targets:
Target 1: 0.01899 USDT (first resistance).
Target 2: 0.02221 USDT (minor supply zone).
Target 3: 0.02632 – 0.03672 USDT (major resistance cluster).
If momentum strengthens across the crypto market, price could extend toward 0.0483 – 0.0603 USDT.
Bullish takeaway: A rebound from this support may mark the start of a medium-term trend reversal.
---
Bearish Scenario 🔴
Confirmation: Daily close below 0.01100 USDT signals breakdown.
Downside targets:
Initial target: 0.00970 USDT (nearest historical low).
Extended target: below 0.009 if sellers dominate.
Bearish takeaway: Losing this critical support could trigger further capitulation and push the market to fresh lows.
---
Key Notes for Traders
1. Volume matters → Breakouts or breakdowns without strong volume often fail.
2. Wait for daily close → Avoid rushing entries based on intraday wicks.
3. Risk management first → Set clear stop loss (below support for longs, above resistance for shorts).
4. Multi-timeframe approach → Use daily for trend, H4/H1 for entry timing.
5. Watch BTC correlation → Altcoins often mirror Bitcoin’s momentum.
---
“TOKENUSDT is at a crossroads! After a prolonged downtrend from early 2025 highs, price is consolidating at the key support 0.0110 – 0.0146 USDT. This is the make-or-break zone: will buyers step in and spark a rebound toward 0.01899 – 0.02221 and beyond? Or will sellers break it down and drag price to 0.00970 USDT?
Volume and daily close confirmation will decide the next big move. Stay disciplined with stop losses and seize the opportunity—because the biggest moves often start at critical levels like this.”
---
#TOKENUSDT #CryptoAnalysis #Altcoin #SupportResistance #TechnicalAnalysis #BullishScenario #BearishScenario #CryptoTrading #SwingTrading
TOKENUSDT 4H Symmetrial TriangleThe market has reached the end of its consolidation phase. Now the question is whether to break through the resistance or continue to fluctuate around the support and resistance levels.

Tokenusdt Buy opporutnityTOKENUSDT appears to have completed an extended corrective structure in the form of a W–X–Y complex. With the pattern now terminating near a well-defined demand zone, the plan is to initiate strategic accumulation from this area. The expectation is to follow the projected recovery path as outlined on the chart, with price action likely to respond positively from this structural base.

TOKENUSDT Forming Bullish WaveTOKENUSDT is currently displaying a promising bullish wave pattern that is catching the attention of traders looking for steady and reliable gains in the crypto market. The pair has shown consistent volume, indicating strong market participation and growing investor interest. While the expected gain of 10% to 20% may seem modest compared to some high-flying altcoins, this setup offers a more stable opportunity for those who prefer lower-risk trades with a clear technical structure.
The current price action suggests that TOKENUSDT is forming higher highs and higher lows, which is a classic sign of a bullish wave continuation. Many traders appreciate this pattern for its clear entry and exit levels, making it easier to manage risk and lock in profits. As the crypto market remains volatile, having a well-structured pair like TOKENUSDT in your watchlist can help diversify your trading portfolio and balance out more aggressive plays.
With a healthy support zone and steady upward momentum, TOKENUSDT has the potential to break through minor resistance levels and deliver the projected gains in the near term. Investors should watch for confirmation candles and spikes in buying volume to validate this bullish scenario. This crypto pair’s relative stability and clear pattern make it an appealing choice for swing traders and trend followers alike.
✅ Show your support by hitting the like button and
✅ Leaving a comment below! (What is You opinion about this Coin)
Your feedback and engagement keep me inspired to share more insightful market analysis with you!

TOKENUSDT 1D AnalysisTOKEN ~ 1D Analysis
#TOKEN This is the lowest support for now. Buy gradually from here with a short term target of at least 15%+ from this support.

TOKENFIThe 4hr chart is showing a cup and handle has formed. If crypto remain bullish we should see a break through in the next couple of candles and ultimately reaching a 3 cent target before it making even bigger moves

TOKENUSDT 1DTOKEN ~ 1D Analysis
#TOKEN Buy after successfully penetrating this resistant line with a short -term target of at least 10%+ from here.

TOKENUSDT 2DTOKEN ~ 2D Analysis
#TOKEN Buy gradually from here if you still have a Conviction on this coin with a short -term target of at least 15%+.

[Long] TOKENUSDT from Tokenfi. RWA's on the blockchain.Hi Traders,
The swigly line on the indicator indicates a reversal. As you can see on January 30th, 2024 the swigly line indicated a reveral. With Ethereum potentially going up to $4800 you can imagine that TOKEN from Tokenfi will go up to .60 cents or more. Token from Tokenfi will put real world assets (RWA's) on the blockchain. Recently a few "premium" members on Tradingview boosted my previous ideas about TOKEN from Tokenfi. I take this as a sign that when Bitcoin and Ethereum go up TOKEN will do the same.
TOKEN is a project from the leaders at FLOKI coin. It bottomed out many months ago at .024 cents. It's now at .027 cents. On the daily chart it shows the top area of interest is around .30 cents on the Maxwell Suite indicator (not shown) When Ethereum goes up to $3500 you will see TOKENUSDT go to around .35 cents and climbing. You can also see that on January 14th, 2025 the red line on the Machine Learning Indicator from Luxalgo which is in the middle of the bars has changed to blue indicating the reversal and uptrend had started. (Just barely) but you're getting in super early.

TOKENUSDT 3DTOKEN ~ 3D Analysis
#TOKEN This is the lowest support for now, Maybe you can consider this support to start buying back from here.

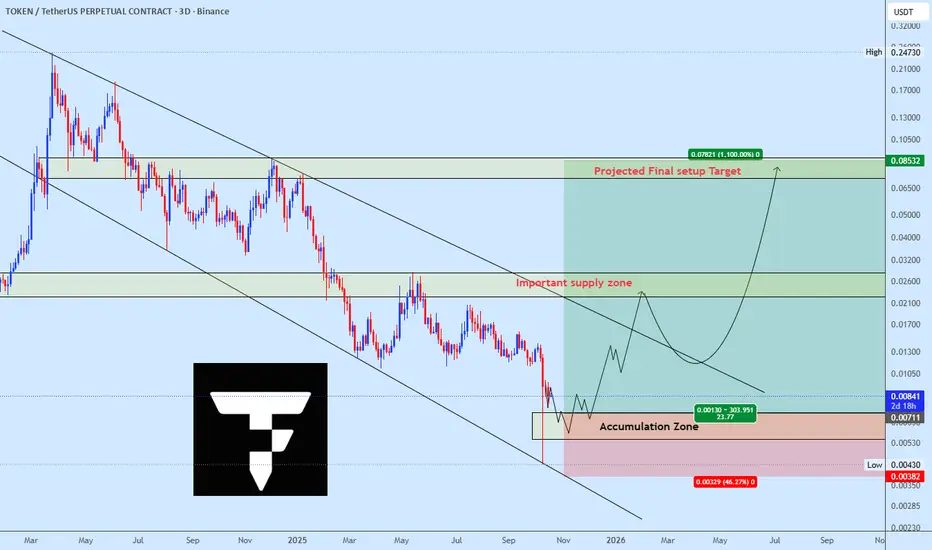
TOKENUSDT Reversal Incoming – Prime Accumulation Zone! 📉 Current Market Outlook:
TOKENUSDT is currently trading in the Discount Zone, signaling an optimal BUY opportunity for smart investors. The price is hovering near a weak low, indicating potential exhaustion of the downtrend.
📊 Key Technical Insights:
✅ Break of Structure (BOS) suggests a shift in momentum.
✅ Accumulation Phase in the discount zone – ideal for strategic entries.
✅ Target Zones:
🎯 Equilibrium Point (~$0.06 - $0.10)
🎯 Premium Zone (~$0.17 - $0.24)
🚀 The Game Plan:
🔹 Accumulate now while price is suppressed.
🔹 Expect a reversal rally towards $0.17 - $0.24 🚀.
🔹 Potential 5x - 7x gains in the coming months!
📢 Final Thoughts:
This is a golden chance to accumulate TOKENUSDT before the next parabolic move. With the right risk management, this setup offers high-reward potential for patient investors.
🟢 Smart Money Moves NOW – Will You? 💰💎
#Crypto #TOKENUSDT #Trading #Investment #Reversal

TOKENUSDT 2DTOKEN ~ 2D
#TOKEN In 2D Time Frame, Still maintaining this support block,. Buy from here if you still have Conviction on this coin with a minimum target of 20%+


TOKEN/USDT NEW BREAK POSSIBILITY TOKEN/USDT NEW BREAK POSSIBILITY
We will follow this coin for the break possibility.

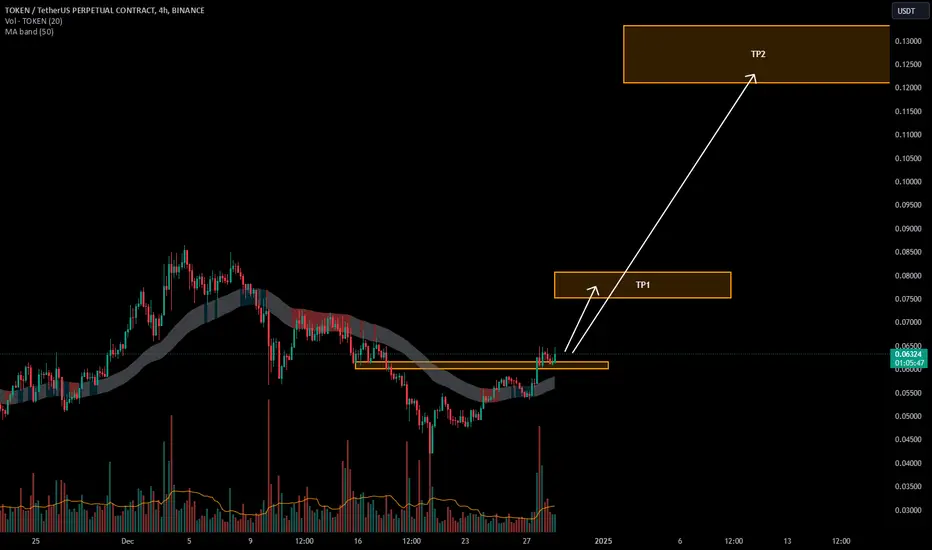
TOKEN/USDTKey Level Zone : 0.06000-0.06150
HMT v3.0 detected. The setup looks promising, supported by a previous upward/downward trend with increasing volume and momentum, presenting an excellent reward-to-risk opportunity.
HMT (High Momentum Trending):
HMT is based on trend, momentum, volume, and market structure across multiple timeframes. It highlights setups with strong potential for upward movement and higher rewards.
Whenever I spot a signal for my own trading, I’ll share it. Please note that conducting a comprehensive analysis on a single timeframe chart can be quite challenging and sometimes confusing. I appreciate your understanding of the effort involved.
If you find this signal/analysis meaningful, kindly like and share it.
Thank you for your support~
Sharing this with love!
HMT v2.0:
- Major update to the Momentum indicator
- Reduced false signals from inaccurate momentum detection
- New screener with improved accuracy and fewer signals
HMT v3.0:
- Added liquidity factor to enhance trend continuation
- Improved potential for momentum-based plays
- Increased winning probability by reducing entries during peaks
TOKENUSDT 2DTOKEN ~ 2D
#TOKEN If you still have Conviction on this coin,. This support block would be a good buying spot for now. buy in stages with a minimum target of 20%++

TOKENFI Breaking the 5 month accumulation period?$TOKEN is finally waking up after a 5 month accumulation period. There are some rumors about future tier 1 listings and there is the $MONKY airdrop.
This could be the right ingredients for a break out!
After the break out #TOKENFI could run to the old ATH. Thats a 200%
BYBIT:TOKENUSDT KUCOIN:TOKENUSDT BITFINEX:TOKENUSD BITFINEX:TOKENBTC BITFINEX:TOKENUST BINANCE:TOKENUSDT.P MEXC:TOKENUSDT GATEIO:TOKENUSDT BYBIT:TOKENUSDT.P CRYPTO:TOKENFUSD KRAKEN:TOKENUSD.PM PHEMEX:TOKENUSDT BITVAVO:TOKENEUR PANCAKESWAP:TOKENWBNB_05616B.USD PANCAKESWAP:TOKENWBNB_05616B

$TOKEN another project from RWA!TOKEN has a good set of investors and market makers who won't miss the opportunity to make money anytime soon. From a technical point of view we expect an upward reaction after 5 Elliot waves! This is confirmed by the consolidation above the 50 EMA. The target for fixation is 1.618 Fibonacci level.
Best regards, Horban Brothers!

TOKENUSDTTOKEN ~ 2D
#TOKEN This coin is in the LSE:RWA sector. Currently it continues to move in this descending pattern. However, selling pressure has weakened.if you have Conviction on the coin,. This support block is a very good place to start buying again. with a minimum target of 15%++


Will #TOKEN Follow Bitcoin's Relief Rally or Not? Key Levels Yello! Are we about to witness a major bullish rally for #TOKENUSDT, or is a sharp reversal lurking around? Let's dive into the detailed analysis of #TokenFi:
💎#TOKENUSDT is currently showing promising signs of a bullish continuation, holding firm at a critical support level around $0.0455. We've been closely monitoring #TokenFi's progress within a Descending Broadening Wedge pattern, and it's now attempting to break above the descending resistance line.
💎If $TOKEN maintains strength at this level, we could be on the brink of a significant rally, echoing past bullish trends. A clean breakout above the key resistance zone of $0.068-$0.081 could open the gates for a run toward higher resistance levels and potentially even new highs.
💎But here's the catch: caution is essential. If momentum weakens around this critical support, we could see a pullback to the lower demand area near $0.036.
💎A daily close below this demand area would invalidate our bullish outlook and could indicate further declines ahead.
Stay vigilant, Paradisers, and keep a close eye on #TOKEN's price action.
MyCryptoParadise
iFeel the success🌴

TOKEN looks bearishAccording to the structure of TOKEN, it seems that it is completing a bearish triangle.
We are now in the last wave of this triangle (wave E).
If it reaches the supply range, we will look for sell/short positions.
The targets are clear on the chart.
Closing a daily candle above the invalidation level will violate the analysis
For risk management, please don't forget stop loss and capital management
Comment if you have any questions
Thank You
