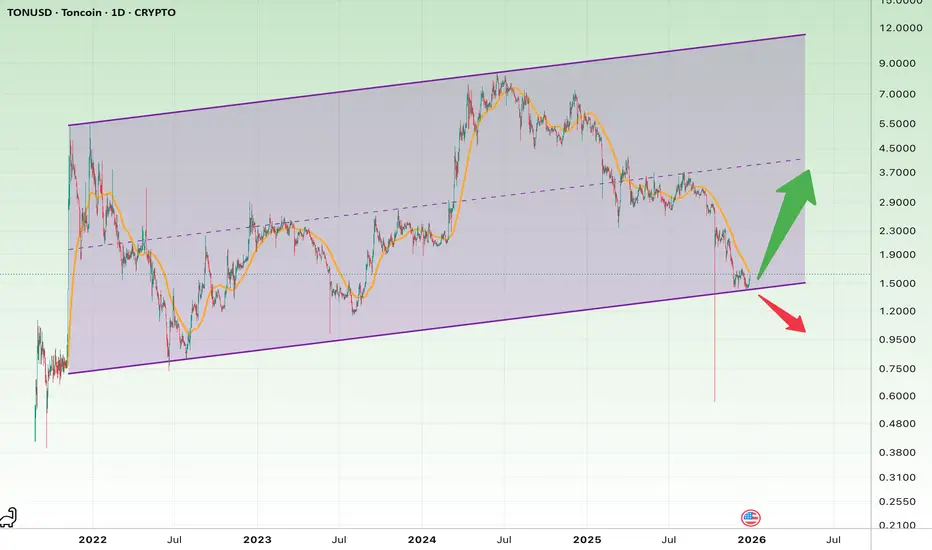
TON at a Major Long-Term SupportOverall Market Structure
• TON is trading inside a long-term ascending channel
• Price is currently sitting right at the lower boundary of this channel
• This zone represents a high-importance decision area from a technical perspective
Short-Term Scenario (Trading View)
Bullish Short-Term S
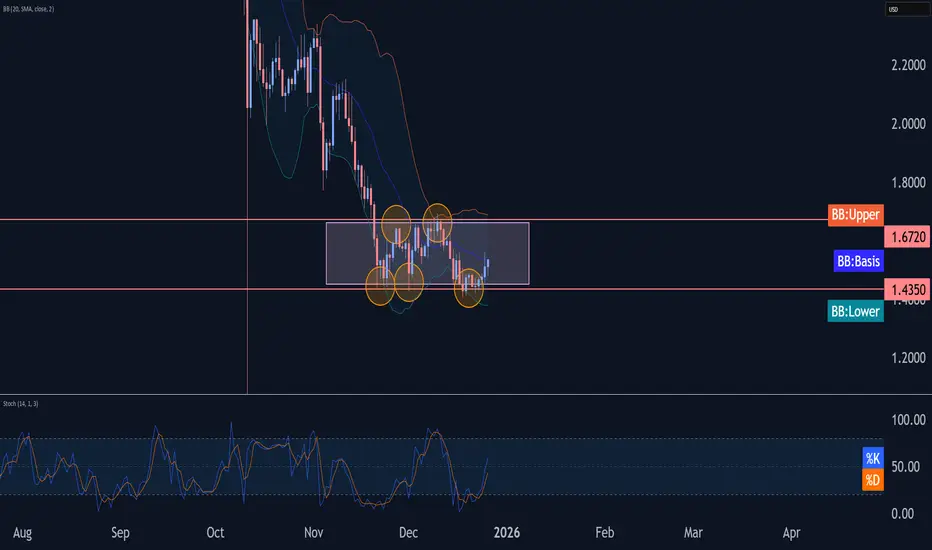
Toncoin Wave Analysis – 26 December 2025 Toncoin reversed from support zone
- Likely to rise to resistance level 1.6720
Toncoin cryptocurrency recently reversed up from the support zone between the key support level 1.4350 (lower border of the narrow sideways price range inside which the price has been trading from November).
This suppo
TON GOOD FUTURE ONE DAYHi traders!
Seems to be that TON is building huge RUNNING FLAT
When it will be completed IMO we gonna see new cycle development
Stay tuned

Nothing !!!As you can see, the price is forming two bullish patterns on the 4h timeframe, If my view is correct, TON will rise to $1.9
And if this pattern is correct and breaks, higher targets are possible.

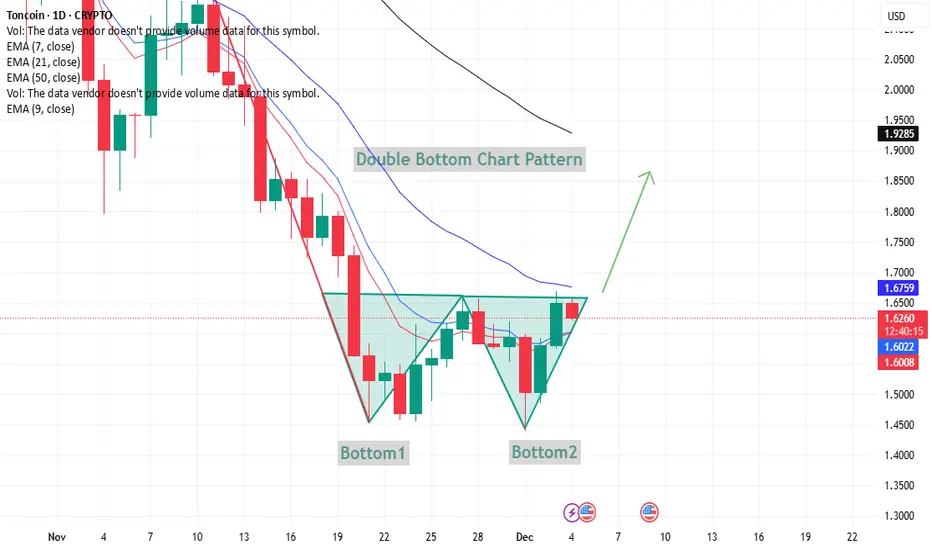
TONUSD – Double Bottom Formation TONUSD – Double Bottom Formation (Neutral Technical View)
The chart shows a double bottom structure, where price formed two lows (Bottom 1 and Bottom 2) near the same zone. This is generally watched as a potential reversal signal when price moves back toward the neckline.
Key observations:
Bottom
TONCOIN (TON/USDT): Wave 5 or Impulse FailureTONCOIN (TON/USDT): Wave 5 or Impulse Failure
📈 Weekly Scenarios
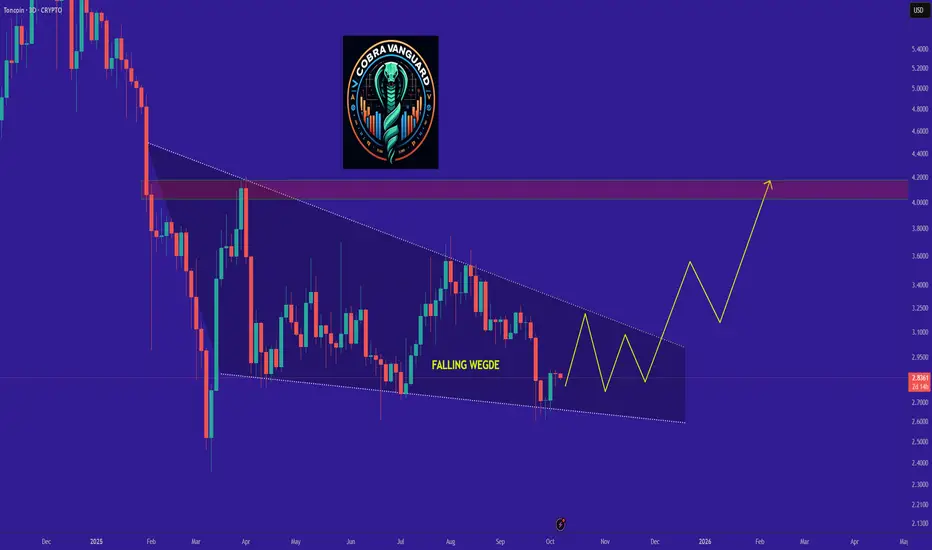
Bullish scenario: Price holds above ~$2.70 and breaks through ~$3.90 → start of wave (3) or (5) up → target ~$5.00+.
Consolidation: Price remains in the ~$2.70-$3.90 range without a clear move, market paused.
Bearish scenario: Price

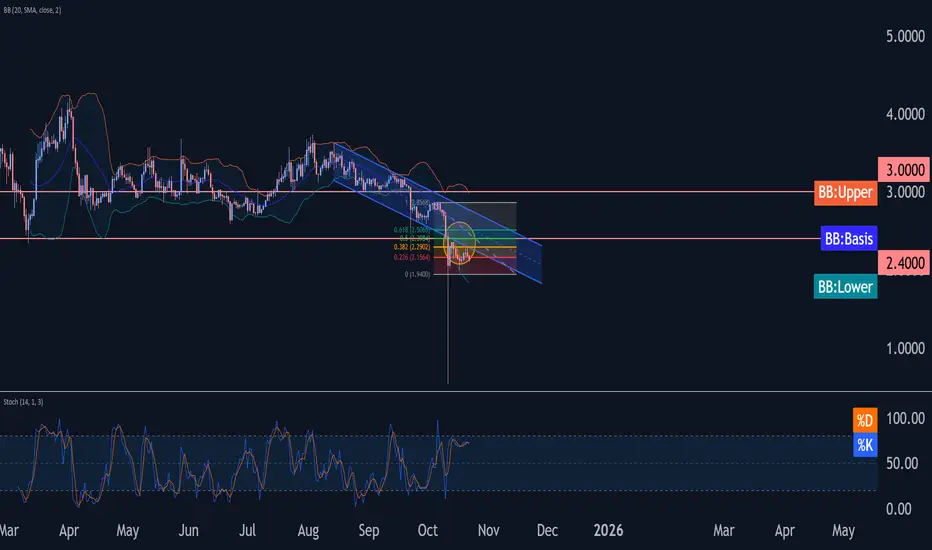
Toncoin Wave Analysis – 21 October 2025
- Toncoin reversed from resistance area
- Likely to fall to round support level 2.0000
Toncoin cryptocurrency recently reversed down from the resistance area between the resistance level 2.4000 (which reversed the price at the start of October) and the lower trendline of the recently broken down c
TON It will grow soon...The triangle pattern will break in the direction it is breached, and the price will move in that direction. In my opinion, the price could be Bullish and may up to $3.6.
Toncoin Wave Analysis – 2 October 2025- Toncoin reversed from support zone
- Likely to rise to resistance level 3.000
Toncoin cryptocurrency recently reversed up with the daily Hammer from the support area between the multi-month support level 2.6000 (former multi-month low from June) and the lower daily Bollinger Band.
The support le

TON/USD – Testing Breakout Zone🟢 LONG above $2.83 – target $2.85
Toncoin trades at $2.82, steadily climbing above SMA200 ($2.72). Resistance sits at $2.83–$2.85. RSI at 61, showing bullish momentum with room before overbought.
📖 Keywords: #TONUSD #Toncoin #CryptoBreakout #MomentumTrade

See all ideas
Summarizing what the indicators are suggesting.
Oscillators
Neutral
SellBuy
Strong sellStrong buy
Strong sellSellNeutralBuyStrong buy
Oscillators
Neutral
SellBuy
Strong sellStrong buy
Strong sellSellNeutralBuyStrong buy
Summary
Neutral
SellBuy
Strong sellStrong buy
Strong sellSellNeutralBuyStrong buy
Summary
Neutral
SellBuy
Strong sellStrong buy
Strong sellSellNeutralBuyStrong buy
Summary
Neutral
SellBuy
Strong sellStrong buy
Strong sellSellNeutralBuyStrong buy
Moving Averages
Neutral
SellBuy
Strong sellStrong buy
Strong sellSellNeutralBuyStrong buy
Moving Averages
Neutral
SellBuy
Strong sellStrong buy
Strong sellSellNeutralBuyStrong buy