Nothing !!!As you can see, the price is forming two bullish patterns on the 4h timeframe, If my view is correct, TON will rise to $1.9
And if this pattern is correct and breaks, higher targets are possible.
Trade ideas

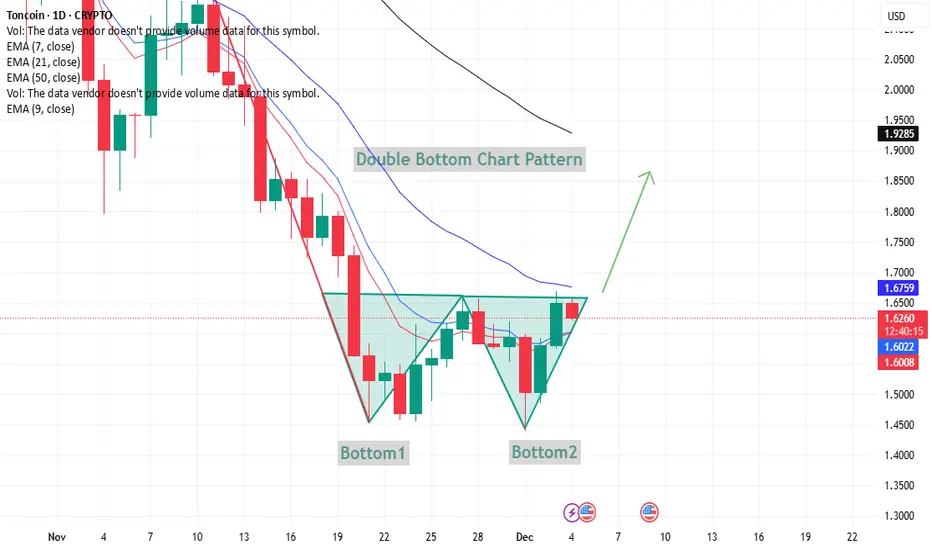
TONUSD – Double Bottom Formation TONUSD – Double Bottom Formation (Neutral Technical View)
The chart shows a double bottom structure, where price formed two lows (Bottom 1 and Bottom 2) near the same zone. This is generally watched as a potential reversal signal when price moves back toward the neckline.
Key observations:
Bottom 1 and Bottom 2 highlight buyers defending the same support area.
Price is now approaching the neckline zone around 1.65–1.67, which is an important technical barrier.
If candles can hold above the short-term EMAs (9 and 21), it strengthens the idea of momentum shifting upward.
A close above the neckline would indicate continuation toward higher resistance levels, while rejection could keep the pair in consolidation.
TONCOIN (TON/USDT): Wave 5 or Impulse FailureTONCOIN (TON/USDT): Wave 5 or Impulse Failure
📈 Weekly Scenarios
Bullish scenario: Price holds above ~$2.70 and breaks through ~$3.90 → start of wave (3) or (5) up → target ~$5.00+.
Consolidation: Price remains in the ~$2.70-$3.90 range without a clear move, market paused.
Bearish scenario: Price breaks below ~$2.60-$2.70 with volume confirmation → start of a corrective wave → possible move to ~$2.10-$2.20.
✅ Conclusion
For the coming week, the technical picture for TON/USDT is on the verge of a reversal.
Holding support at ~$2.60-$2.70 and breaking above ~$3.90 could activate upward momentum.
A breakout below $2.60 is a signal for caution and a possible decline.
The wave count is still unclear, so it's important to monitor the price reaction at key levels.

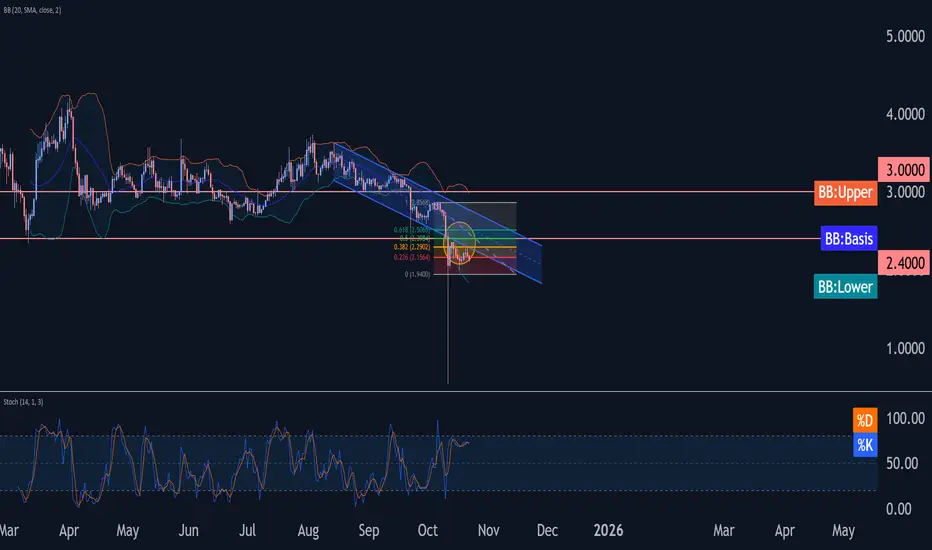
Toncoin Wave Analysis – 21 October 2025
- Toncoin reversed from resistance area
- Likely to fall to round support level 2.0000
Toncoin cryptocurrency recently reversed down from the resistance area between the resistance level 2.4000 (which reversed the price at the start of October) and the lower trendline of the recently broken down channel from August.
The downward reversal from this resistance area stopped wave (b) of the previous short-term ABC correction 2.
Given the clear daily downtrend, Toncoin cryptocurrency can be expected to fall to the next round support level 2.0000 (low of the earlier wave a).
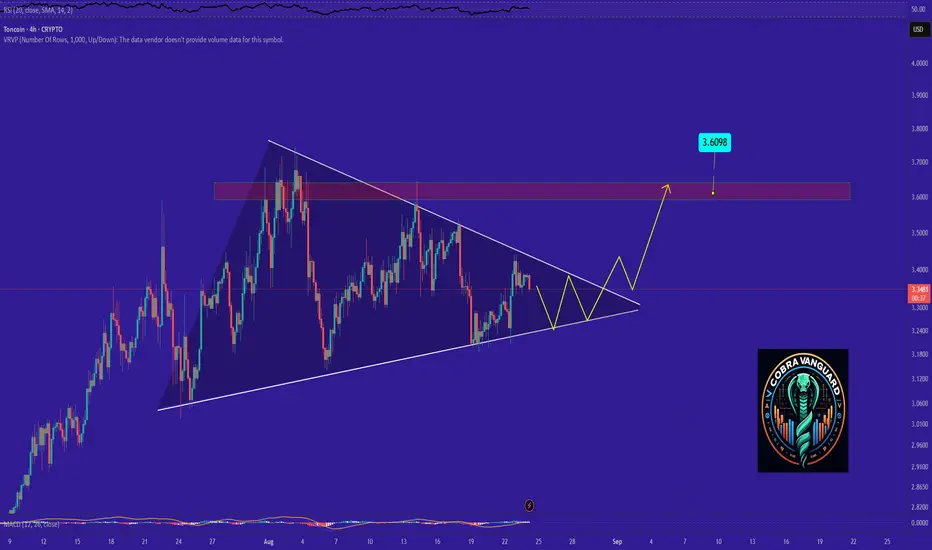
TON It will grow soon...The triangle pattern will break in the direction it is breached, and the price will move in that direction. In my opinion, the price could be Bullish and may up to $3.6.
Toncoin Wave Analysis – 2 October 2025- Toncoin reversed from support zone
- Likely to rise to resistance level 3.000
Toncoin cryptocurrency recently reversed up with the daily Hammer from the support area between the multi-month support level 2.6000 (former multi-month low from June) and the lower daily Bollinger Band.
The support level 2.600 was strengthened by the intersecting lower support trendline of the downward sloping channel from August.
Given the strength of the support level 2.6000, Toncoin cryptocurrency can be expected to rise to the next round resistance level 3.000 (former support from July).

TON/USD – Testing Breakout Zone🟢 LONG above $2.83 – target $2.85
Toncoin trades at $2.82, steadily climbing above SMA200 ($2.72). Resistance sits at $2.83–$2.85. RSI at 61, showing bullish momentum with room before overbought.
📖 Keywords: #TONUSD #Toncoin #CryptoBreakout #MomentumTrade

My only remaining hope for Toncoin !!!My only remaining hope for Toncoin is this PRZ. If the price holds this level, it could rise above $3 otherwise, you know what will happen if this level breaked...
TON/USD – Range Compression⚪ Neutral bias, watch $2.77–2.82 zone
Toncoin trades at $2.789, stuck between support at $2.768 and resistance at $2.818 (SMA200). RSI at 49, flat momentum. Needs breakout of this tight band for direction.
📖 Keywords: #TONUSD #Toncoin #CryptoRange #AltcoinWatch

Toncoin Wave Analysis – 23 September 2025
- Toncoin reversed from key support level 2.7515
- Likely to rise to resistance level 3.0000
Toncoin cryptocurrency recently reversed up from the key support level 2.7515 (which has been steadily reversing the price from the start of April).
The upward reversal from the support level 2.7515 stopped earlier impulse wave (c) – which belongs to the downward impulse wave B from May.
Given the strength of the support level 2.7515 and the bullish divergence on the daily Stochastic, Toncoin cryptocurrency can be expected to rise to the next round resistance level 3.0000 (former strong support from July and August).

tonusdt Right now, TON Coin still has a way to go before it really hits mass adoption. It’s only just been listed in the U.S. and is still in the early days of building its user base. That said, this project isn’t just good — it’s better than anything else out there, even Solana, when it comes to vision, tech, and execution.
Thanks to heavy investment in NFT infrastructure, TON has already climbed to the #1–#2 spot globally in NFT trading volume and even rolled out NFT 2, pushing the whole space forward.
The blockchain’s development speed is unlike anything you’ve seen — it’s moving just like Telegram did in its early days. Whatever you can imagine, they’re already building it on TON. Something that might take three years to launch on Solana or Ethereum could be developed and rolled out on TON in under a year.
For now, the team isn’t chasing short‑term price spikes — they’re laser‑focused on building an unshakable foundation. And when this thing reaches maturity, TON has a very real shot at becoming the second‑largest blockchain in the world.

TONThe recent market structure shows the formation of a Quasimodo (QM) pattern. After breaking the descending trendline, price created a lower high followed by a slightly higher high, which is a typical signature of the QM setup. This pattern often signals a potential shift in market direction as liquidity is taken above previous highs before a new impulse move develops.

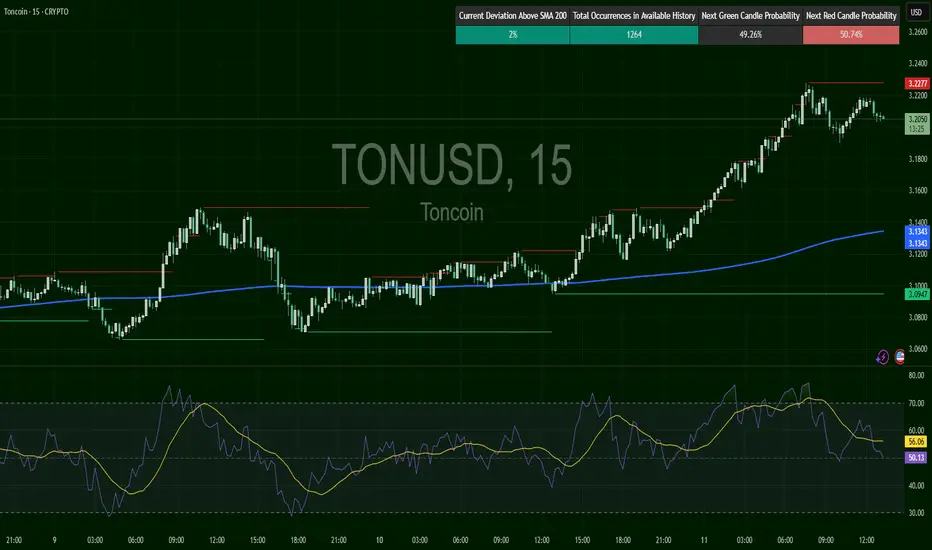
TON/USD – Overextended Near Resistance🔴 SHORT below $3.22 – target $3.14
Toncoin trades at $3.20, just under resistance at $3.22–3.27. SMA200 supports lower at $3.13. RSI cooling from 56 → 51, showing fading momentum. Bulls risk exhaustion unless price clears $3.27.
📖 Keywords: #TONUSD #Toncoin #AltcoinReversal #BearishSetup #CryptoCorrection
TON/USD – Breakout Attempt🟢 LONG above $3.1985 – target $3.25+
Toncoin trades at $3.177, holding above the 200 SMA ($3.1386). Price just tested resistance at $3.1985. RSI at 61 shows bullish momentum. A breakout above $3.1985 could open the way toward $3.25–$3.30.

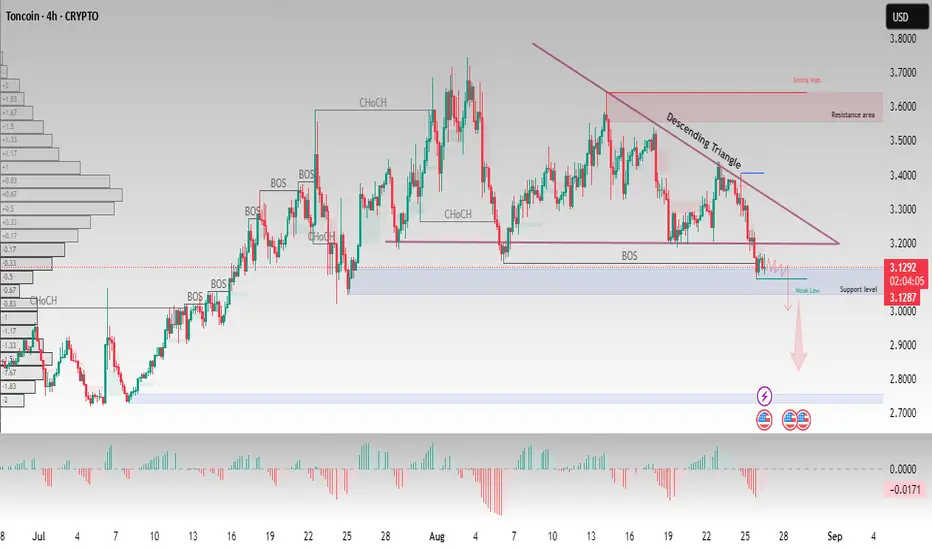
Toncoin(TONUSD) – Descending Triangle Breakdown Near Key SupportToncoin has been trading inside a descending triangle formation, showing consistent lower highs while testing the $3.10 support level multiple times.
🔹 Price is currently consolidating at support after a recent break of structure (BOS).
🔹 If this weak low gives way, the next major downside target could be around the $2.80 – $2.70 zone, where historical demand and volume profile support are aligned.
🔹 Resistance remains strong at the $3.50 – $3.70 area, and bulls would need to reclaim this zone to shift momentum back upward.
This setup highlights the importance of the $3.10 support level—a decisive move below may confirm further bearish continuation.
Keep an eye on volume reaction and price confirmation before making any trading decisions.
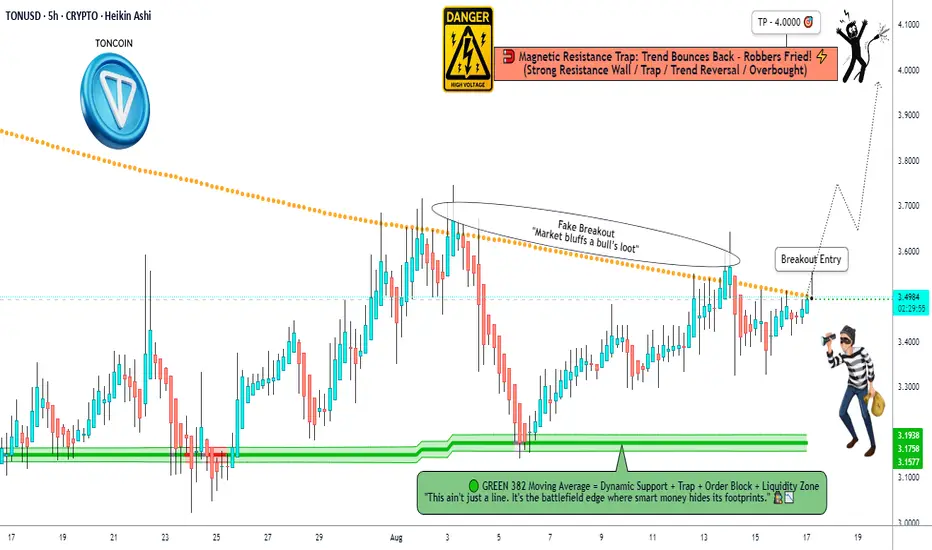
TON/USD Market Trap or Treasure? Decide Before 4.000!🚨TON/USD "TONCOIN vs U.S DOLLAR" Crypto Heist Plan 🚨
💎 Hello Thief OG’s, Money Grabbers & Market Shadows!
Today’s mission is locked 🔐 – we’re breaking into the TON/USD vault with a Bullish Heist Strategy.
🎯 Plan of Attack
Asset: TON/USD "TONCOIN vs U.S DOLLAR"
Mode: Bullish 🟢 (Heist in progress)
Entry (Thief Layers):
💰 Layer 1 @3.4900
💰 Layer 2 @3.4500
💰 Layer 3 @3.4000
💰 Layer 4 @3.3600
(You can add more layers – the deeper the vault, the sweeter the loot!)
Stop Loss (SL) 🛑: @3.2600 – This is the Thief Emergency Exit.
🔐 Adjust based on your own strategy & risk appetite.
Target (Escape Point) 🏆: @4.0000
⚡ “High Voltage Zone” ahead – escape with your loot before the alarms ring!
🕵️♂️ Thief Strategy Style
This is not a single-door entry – we’re layering multiple buy limit orders, stacking our positions like a true market bandit. 📊
Stay sharp – once the bags are full, we run with the profit! 🏃♂️💨
⚠️ Heist Rules for OG’s
Only rob the long side – trend is with the bulls. 🐂
Use trailing SL to protect stolen money 💵.
Don’t get caught in news traps – avoid new entries during 🔔 big announcements.
💥 Boost this plan 💥 if you’re riding with the Thief Crew!
Together, we rob the market – layer by layer, vault by vault. 💰🚀
📌 Disclaimer: This is a Thief Trading style heist plan, not financial advice. Trade with your own risk management.
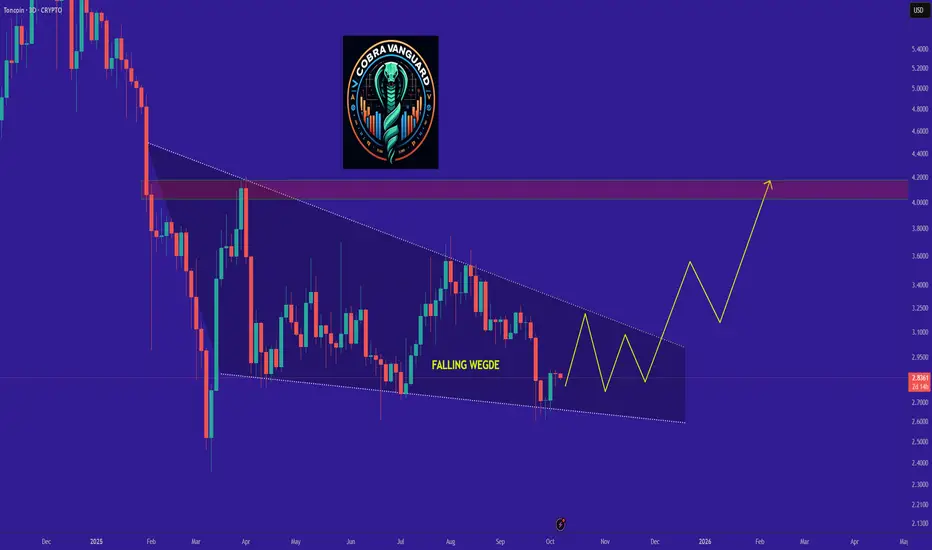
we shall see a good amount of increase in TON price !The triangle pattern will break in the direction it is breached, and the price will move in that direction. In my opinion, the price could be Bullish and may up to $4.
TONCOIN Shows Neutral-Bearish SentimentTONCOIN is showing neutral-bearish sentiment — a slight daily increase, but technical signals on most indicators are directed towards Sell.
Technical picture
Bitget (1D summary):
General signal: Sell
Oscillators: 2 Sell, 2 Buy, 6 Neutral
Moving Averages: 12 Sell, 1 Buy, 2 Neutral
1-day: Strong Sell
1-week / 1 month: Strong Sell
Moving Averages (MA): Buy: 10, Sell: 2
Oscillators: Buy: 6, Sell: 1
Final signal: Strong Buy on daily indicators — difference in data with Bitget on different timeframes.
Key levels
Pivot (classic): $0.001862
Support: S1 ≈ $0.001783
Resistance: R1 ≈ $0.001844
Market dynamics
The price dropped below $0.001800, signaling bearish pressure with the formation of "bearish engulfing".
RSI dropped to 26.8 (oversold zone), a short-term reaction is possible.
Bollinger Bands are narrowing - volatility may increase.
Trading volume is high, which confirms the dominance of sellers in the session.

TON It will grow soon...The triangle pattern will break in the direction it is breached, and the price will move in that direction. In my opinion, the price could be Bullish and may up to $3.6.
TONCOIN Neutral dynamics prevail on most timeframesOverall technical sentiment
Today's signal: Neutral — neutral dynamics prevail on most timeframes and technical indicators. 1-week rating is also balanced, and 1-month — shows "Sell"
Technical indicators
Overall technical conclusion: Strong Sell
Moving Averages: 5 Buy, 7 Sell
Oscillators: 1 Buy, 8 Sell
Summary: Strong Sell — technical indicators and averages point to downward pressure.
Main indicators:
RSI (14): ~46 — neutral
Stochastic: neutral
StochRSI: Sell
MACD: Buy
ADX: Sell
Williams %R: Sell
CCI: Sell
ROC: Sell
Most oscillators are on the sellers' side.
Moving Averages:
MA5/MA10/MA20: Sell
MA50/MA100/MA200: Buy — several mid-term MAs support a possible reversal.
Pivot levels (Classic):
S1: $3.3368
Pivot: $3.3472
R1: $3.3526 — nearest resistance.
Volume and Market Data
Current TON Price: ~$3.34
24-hour range: $3.33–$3.41
Trading Volume: about $170–200 million
Capitalization: ~$8.58 billion,

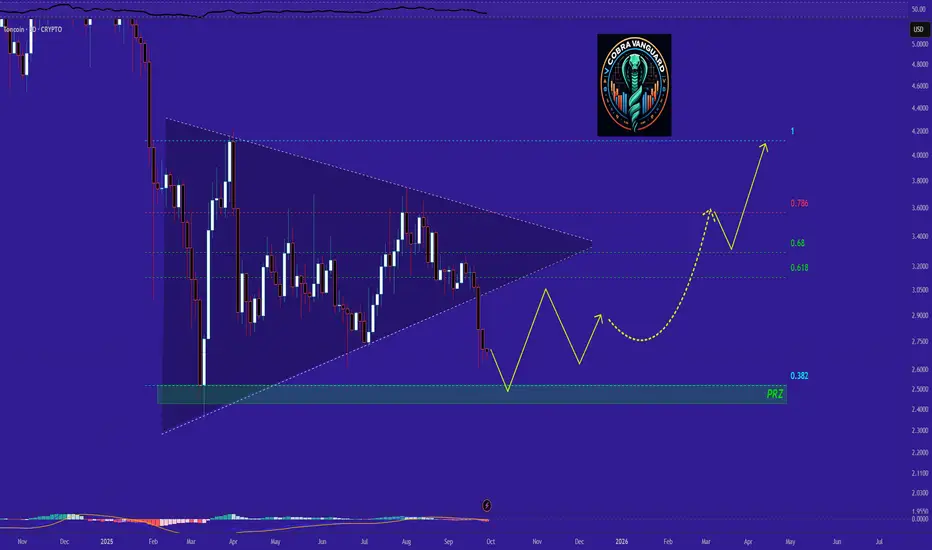
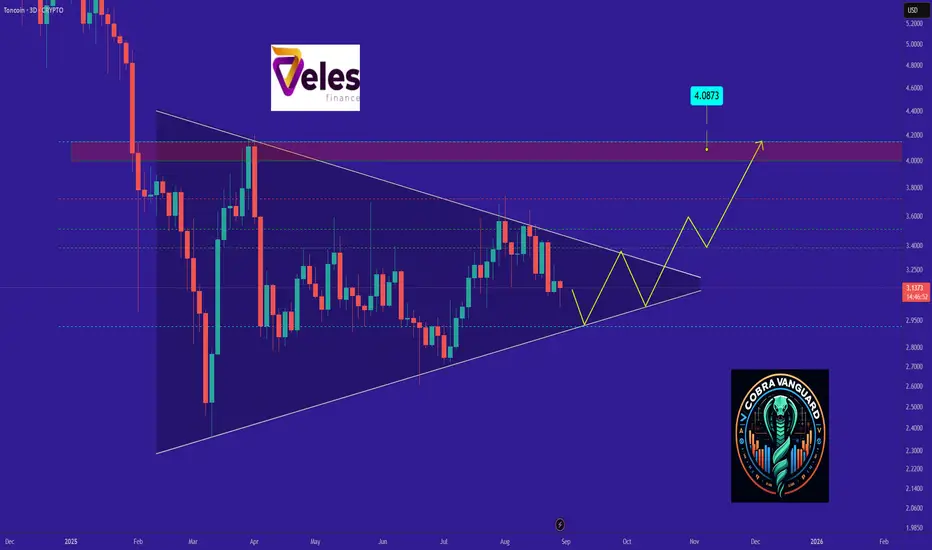
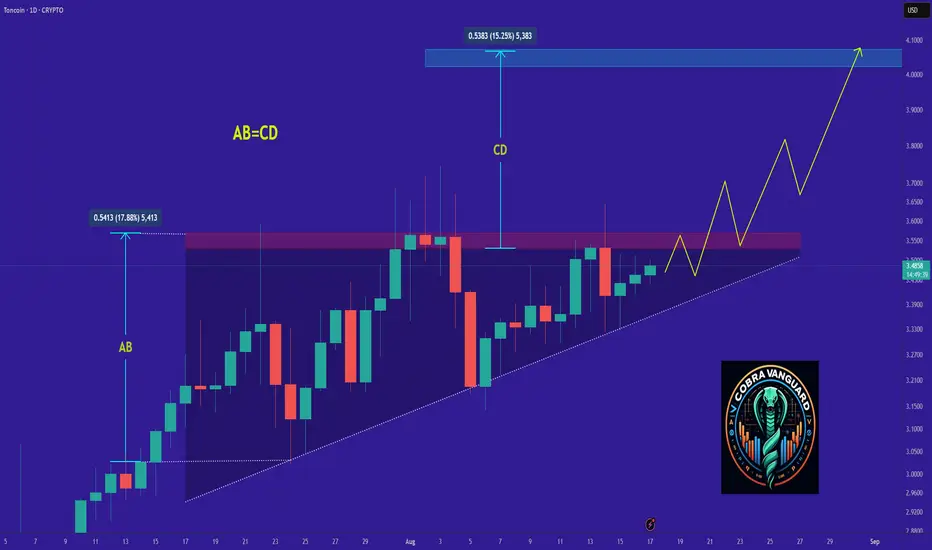
TON's Situation, A Comprehensive Analysis !!!The price on the Daily timeframe is within an ascending triangle, which can be promising. If the price breaks this pattern with bullish candles, it could easily rise by the distance of AB=CD .
Best regards CobraVanguard.💚
TON/USDT – H1 Market OutlookPrice is currently sitting near the P1D Low after a strong bearish move from the Strong High zone.
Possible Scenarios:
1️⃣ Bullish Reaction:
Hold above P1D Low → push toward P1D High (~3.54) for a potential retest.
2️⃣ Bearish Continuation:
Break below P1D Low → drop toward Equal Lows (~3.30) for liquidity sweep.
Key Levels:
Resistance: P1D High (~3.54), Swing High (~3.65), Strong High (~3.70)
Support: P1D Low (~3.35), Equal Lows (~3.30)
📌 Plan: Watch the P1D Low reaction — holding it favors a short-term bullish retracement, losing it opens the door for a deeper drop.

TON/USD – Scalper’s Playbook Price is consolidating around the 3.3910 Day High after a recent CHoCH and OB retest. This is a prime intraday setup with quick reaction zones for both directions:
1️⃣ Bullish Scalps – Quick long entries on bullish reaction from the 3.36 OB Buy Zone, targeting the 3.42 OB for fast profits.
2️⃣ Bearish Scalps – If OB fails, short entries towards the 3.2744 Day Low and Strong Low for a deeper sweep before reversal.
Scalping Key Levels:
Buy Zone: 3.36 OB
Bullish Target: 3.42 OB
Bearish Targets: 3.33 / 3.27 Strong Low
Bias: Neutral, scalp both ways based on reaction.
📌 This setup is built for speed — perfect for quick in-and-out scalps. Wait for candle confirmation before entry.
