TON/USDT | TON Holding Support, Watching for a Stronger Push!By analyzing the #TON chart on the weekly timeframe, we can see that after dropping to $1.40, price attracted demand again and is now trading around $1.65. If TON Coin can hold and stabilize above $1.58, we can expect more upside in the short term.
The bullish momentum is present but still weak, so we need to see stronger moves from TON. The next upside targets are $1.74, $2.00, and $2.22.
Please support me with your likes and comments to motivate me to share more analysis with you and share your opinion about the possible trend of this chart with me !
Best Regards , Arman Shaban
Market insights

Lingrid | TONUSDT Bullish Move Above Accumulation AreaOKX:TONUSDT has shifted out of its prolonged accumulation phase, with price accepting above the former range after a decisive breakout. The move cleared the descending trendline, suggesting that selling pressure has weakened and control is gradually rotating back to buyers. Current price action shows consolidation above the breakout level rather than an immediate rejection, which supports a continuation setup.
A short-term dip toward the 1.50 area remains possible as the market digests the expansion move, but as long as price holds above this zone, the structure stays constructive. Sustained support here could allow another impulsive push toward the upper resistance band around 1.57.
➡️ Primary scenario: consolidation or shallow pullback above 1.50 → continuation higher toward 1.572.
⚠️ Risk scenario: failure to hold above 1.50 would invalidate the breakout and bring the lower range back into play.
If this idea resonates with you or you have your own opinion, traders, hit the comments. I’m excited to read your thoughts!

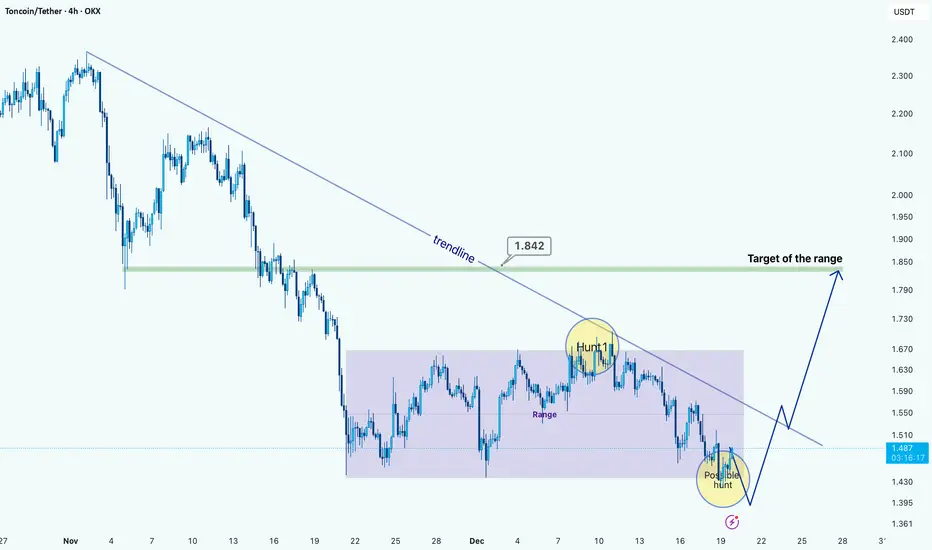
TON/USDT: Range Structure Within a Broader DowntrendHi!
TON is still trading under a well-defined descending trendline, confirming that the higher-timeframe structure remains bearish. After the impulsive sell-off, the price transitioned into a clear consolidation range, highlighted on the chart. This range shows multiple reactions at both extremes, validating it as an accumulation/distribution zone rather than random price action.
A notable liquidity hunt occurred near the upper boundary of the range, where price briefly swept highs and was immediately rejected, aligning with the descending trendline and reinforcing it as dynamic resistance. Currently, price is trading near the lower boundary of the range, where another potential liquidity sweep may occur before a directional move.
Bullish scenario: A downside sweep below the range lows, followed by strong acceptance back inside the range, could trigger a reversal toward the range high near 1.84, which also aligns with the descending trendline and acts as a logical target.
Bearish scenario: Failure to reclaim the range after a breakdown would confirm continuation of the downtrend, exposing lower supports.
TON/USDT | Weak momentum (READ THE CAPTION)In the 4H chart of TONUSDT we can see that after it hit the Bullish Breaker, it went up and it is now being traded at 1.635. However, the bullish momentum is still weak and we are yet to see a strong move from TON.
Current bullish targets: 1.693, 1.761 and 1.830.

TON - Swing LongToncoin is setting up for a nice R/R swing long. Looking for 25% upside potential back to the Oct/Nov pivot point if it can break Dec high.

TONUSDT 1D#TON is trading near the descending resistance and the daily SMA50. Buying can be considered at current levels and near the support zone. If a breakout above both resistance levels occurs, the potential upside targets are:
🎯 $1.747
🎯 $1.946
🎯 $2.107
🎯 $2.268
🎯 $2.497
🎯 $2.789
⚠️ Always apply tight stop-losses and maintain strict risk management.

TON: an idea in a day.We have a local long idea for TON up to the upper limit of the range.
We only enter after confirmation and a stop in the long zones. If we fall below that limit, we simply skip it.
BINANCE:TONUSDT.P

TradeCityPro | TON Range Tightens, Breakout Probability Rising👋 Welcome to TradeCity Pro!
In this analysis, I want to review the TON coin for you. One of the popular crypto projects that belongs to the Telegram platform, and with a market cap of $4 billion, it is ranked 26th on CoinMarketCap.
⏳ 4-hour timeframe
This coin has formed a range box on the 4-hour timeframe, and like most altcoins, it is currently ranging.
⚡️ The bottom of the range box is at 1.45 and the top of the box is at 1.68, and for several days now, volume inside this box has been increasing.
📊 This increase in volume indicates the presence of traders in this coin, and if volume continues to increase, the probability of a range breakout will rise.
✔️ Currently, most of the volume is buy volume, and the probability of breaking the 1.681 resistance has increased.
⭐ The higher low that the price has formed is at 1.562, and as long as the price stays above this level, we can expect that if 1.681 breaks, an upward bullish move will start.
🎲 However, if the price gets rejected from 1.681 and moves downward, breaking 1.562, then with the break of 1.45, we can open a short position.
📝 Final Thoughts
Stay calm, trade wisely, and let's capture the market's best opportunities!
This analysis reflects our opinions and is not financial advice.
Share your thoughts in the comments, and don’t forget to share this analysis with your friends! ❤️

#TON/USDT : Trendline Break & Double Bottom#TON
The price is moving in a descending channel on the 1-hour timeframe. It has reached the lower boundary and is heading towards a breakout, with a retest of the upper boundary expected.
We are seeing a bearish trend in the Relative Strength Index (RSI), which has reached near the lower boundary, and an upward bounce is expected.
There is a key support zone in green at 1.39, and the price has bounced from this level several times. Another bounce is expected.
We are seeing a trend towards stabilizing above the 100-period moving average, which we are approaching, supporting the upward trend.
Entry Price: 1.47
First Target: 1.48
Second Target: 1.52
Third Target: 1.57
Remember a simple principle: Money Management.
Place your stop-loss order below the green support zone.
For any questions, please leave a comment.
Thank you.

TON . Structure Holding After DistributionTON went through a clear distribution phase after the impulsive move lower, followed by a sharp sell-off that flushed weak hands and triggered stop runs. After that liquidation, price found demand and began forming a base, signaling that sellers were losing control.
Since then, the market has been building higher lows along a rising diagonal, showing that buyers are stepping in earlier on every pullback. This is not aggressive buying, but controlled absorption. Each dip into the diagonal support has been defended, and downside momentum has clearly slowed.
What stands out is the change in behavior. Instead of extended impulsive drops, price is now consolidating, ranging, and grinding higher. This usually indicates positioning rather than distribution. Volatility compression around rising support often precedes expansion.
As long as price continues to respect this ascending structure, the bias remains constructive. A sustained hold above the diagonal keeps the market in accumulation mode. A clean breakdown and acceptance below it would invalidate the setup and open the door for continuation to the downside.
For now, structure favors patience and confirmation rather than chasing moves. The market is building, not breaking.

Lingrid | TONUSDT Break and Retest Shorting Opportunity OKX:TONUSDT has slipped back below consolidation floor, confirming a loss of balance after repeated failures to reclaim the descending trendline. The latest bounce formed another lower high beneath the red resistance line, signaling that bearish pressure may still be dominant. Price acceptance below the 1.50 pivot suggests the recent recovery attempt could have been corrective rather than trend-changing.
If downside pressure persists, it might drift toward the 1.30 support pocket, where the broader channel base and historical demand converge. That area could become the next focal point if the breakdown continues to attract momentum sellers.
➡️ Primary scenario: rejection below 1.50 → continuation toward 1.30.
⚠️ Risk scenario: a firm reclaim and close above 1.55 may weaken the bearish setup and allow a push back toward 1.65.
If this idea resonates with you or you have your own opinion, traders, hit the comments. I’m excited to read your thoughts!

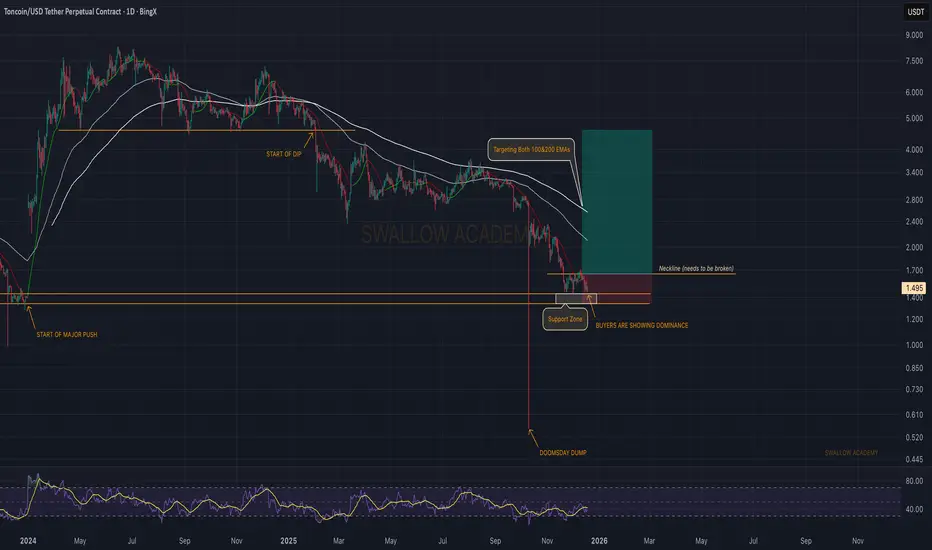
Toncoin (TON): Looking For Break of Neckline | Expecting UP MoveTON is holding the local support zone well and buyers are starting to show dominance again in this area. The reaction from this zone is clean so far, which keeps the bullish idea valid.
Game plan is simple here: we’re waiting for a break of the local neckline. If that neckline gets reclaimed and accepted, this opens the door for a solid upside move from here toward the higher targets.
Swallow Academy
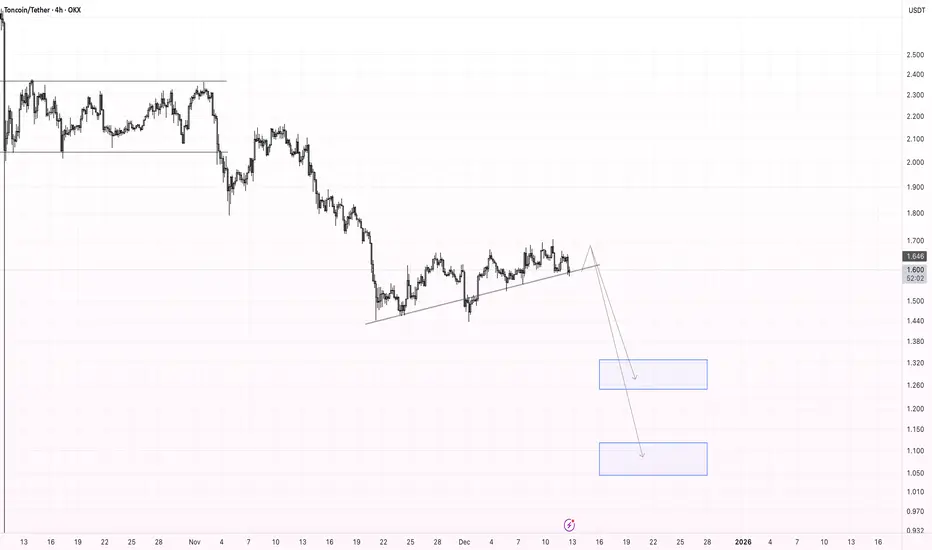
TON Correction Scenario: $1.33 → $1.10 TargetsPrice is breaking below the local ascending trendline, signalling a potential shift in short-term momentum. If the breakdown holds, I expect a continuation to the downside toward the next support zones. My targets are $1.33 as the first demand area and $1.10 as the secondary, deeper target.
#TON/USDT : Trendline Break & Double Bottom#TON
The price is moving in a descending channel on the 1-hour timeframe. It has reached the lower boundary and is heading towards breaking above it, with a retest of the upper boundary expected.
We have a downtrend on the RSI indicator, which has reached near the lower boundary, and an upward rebound is expected.
There is a key support zone in green at 1.53. The price has bounced from this zone multiple times and is expected to bounce again.
We have a trend towards stability above the 100-period moving average, as we are moving close to it, which supports the upward movement.
Entry price: 1.60
First target: 1.64
Second target: 1.69
Third target: 1.755
Stop loss: Below the support zone in green.
Don't forget a simple thing: capital management.
For inquiries, please leave a comment.
Thank you.

TON Trend Continuation Confirmed After Support ReactionTON delivered the reaction we were anticipating after respecting the rising trend support. The market absorbed selling pressure cleanly and responded with impulsive bullish continuation, confirming that buyers remain in control of structure.
The sequence of higher lows remains intact, and the breakout was not driven by a single spike but by sustained acceptance above the prior range. This behavior typically signals continuation rather than distribution. Pullbacks since the breakout have been shallow and corrective, suggesting strong demand rather than profit-taking dominance.
As long as price holds above the former resistance turned support, the bullish structure remains valid. Any retrace into that zone is still considered a potential continuation setup, while a clean loss of trend support would be the first signal of structure weakness. For now, momentum favors continuation over mean reversion.

TON/USDT — Market StructurePrice has broken down and consolidated below the global channel.
TON remains in a steady downtrend with weak relief bounces.
At the same time, early signs of a potential reversal are emerging:
— a double bottom has formed,
— a bullish divergence is present,
— weekly RSI is at historical oversold levels.
Long entries can be considered at current levels with a stop-loss below the low.
🎯 Primary target: the deviation level and a retest of the channel from below.
Higher targets should be considered only after price reclaims and holds back inside the channel.

The recent impulsive drop broke a key support zonePrice is trading within a clear bearish market structure on the 4H timeframe, with consecutive lower highs and lower lows confirming seller control. The recent impulsive drop broke a key support zone, which is now acting as resistance.
The current pullback into the marked supply area represents a classic sell-on-retest scenario. Lack of strong bullish momentum and weak follow-through from buyers suggest that this move is corrective rather than a trend reversal.
RSI remains below the midline, indicating bearish momentum dominance and no clear bullish divergence. This supports continuation to the downside.
The sell position targets the next demand/liquidity zone below, while the stop loss is placed above the resistance zone to invalidate the bearish structure. This setup offers a favorable risk-to-reward aligned with

TON - Long idea.The TON looks pretty long. The structure is good. I expect another test near the local low. Ideally, we should break through the low and rise!
I've sketched out a rough plan and set up alerts. I'll be watching!
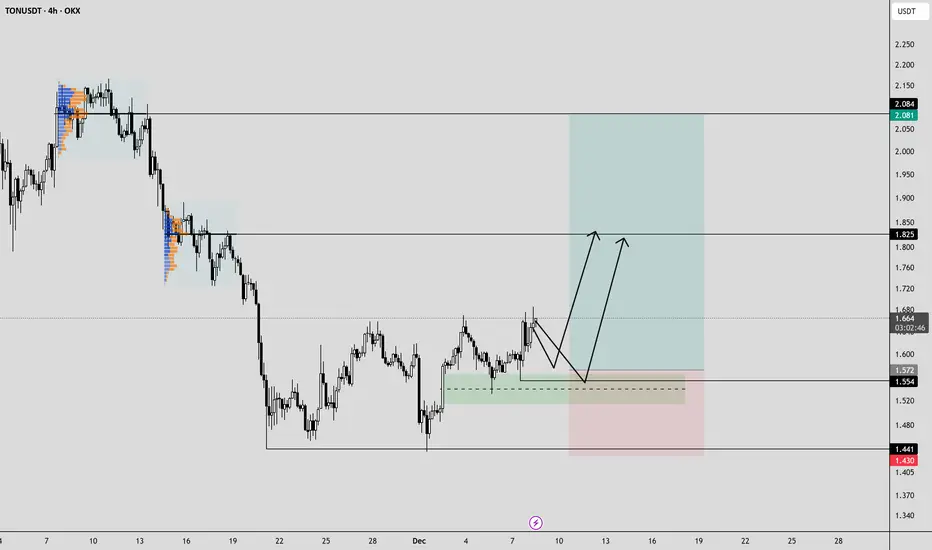
Lingrid | TONUSDT Potential Long During Consolidation PhaseOKX:TONUSDT continues to trade within a consolidating structure, but it's printing a sequence of higher lows while holding above the $1.60 base. The recent pullback found demand near this support region, where buyers stepped back in and defended trend support. Price action suggests the latest dip could be corrective rather than the start of a reversal.
If momentum rebuilds above the mid-range and holds above channel support, price may attempt another drive toward the 1.70 resistance zone, where prior highs and sell-side liquidity sit. That area could act as a magnet if buyers maintain control and volatility expands to the upside.
➡️ Primary scenario: hold above 1.60 → continuation toward 1.70.
⚠️ Risk scenario: sustained acceptance below 1.60 may weaken the structure and expose a deeper pullback toward 1.55.
If this idea resonates with you or you have your own opinion, traders, hit the comments. I’m excited to read your thoughts!

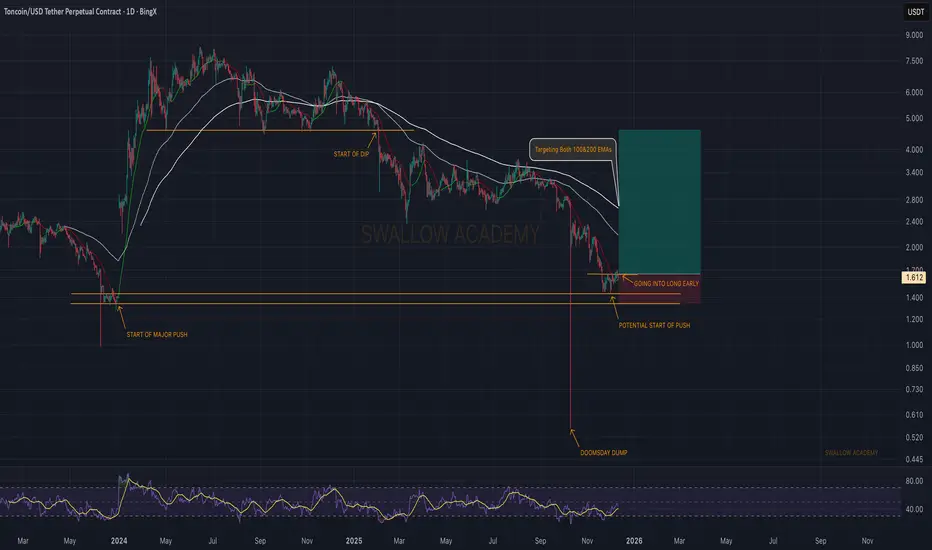
Toncoin (TON): Getting Into Early Long Here | Bullish SetupTON is trying to build a local bottom after that sharp flush, and buyers are starting to show interest around this support zone again. This is the same region where the last major push began, so it naturally attracts reaction.
For the long idea to play out, buyers need to push price back toward the 100 and 200 EMAs and reclaim them. That would be the first real sign that momentum is shifting. Until then, EMAs remain the main target and the first hurdle.
If buyers manage to take control here, the structure allows a steady climb back into the upper zones where the bigger move could start forming.
Swallow Academy
TON Sits at a Critical Turning PointTON continues to trade inside a broad descending structure, but price is now pressing against a key trendline that has rejected every rally for weeks. This compression is creating a decision point.
A zone of demand has formed just beneath price, aligning with the mid-range of the falling wedge. This region has acted as support multiple times, showing that buyers are still defending. At the same time, the upper trendline is steadily guiding price lower and compressing volatility.
If the market holds above this support range and reclaims the short term structure, the next wave of expansion can begin. A clean breakout above the descending trendline would open the path toward the previous imbalance levels and the higher value zones above.
However, a failure to maintain this support may trigger one more downward leg into the lower boundary of the channel before any renewed attempt at recovery.
TON is entering a phase where price will reveal the next directional move. Patience is important as the structure prepares for expansion.

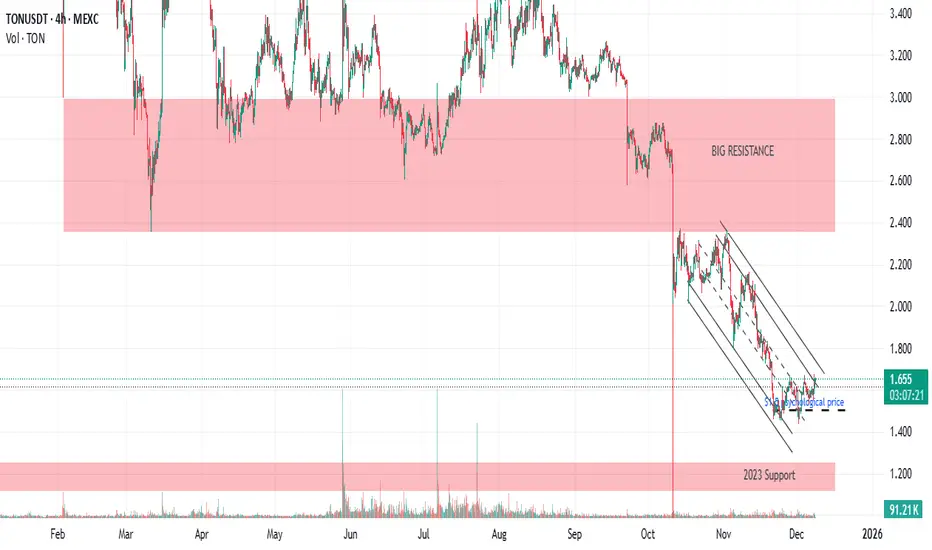
TONCOIN heads towards major resistance at $3After the decline that occurred on 10/10, MEXC:TONUSDT closed the wick candle with a very neat trendline.
Will it break the trendline and try to rise to $3 resistance?
$1.5 would be the psychological price
Ton Buy SetupThis weekend was very Volatile that all of short term position liquated & Shaked out. but my opinion about bullish price didn't change. My target for Ton for next days 2.2 and 2.5 . then let see what will happen.
