TON/USDT: Range Structure Within a Broader DowntrendHi!
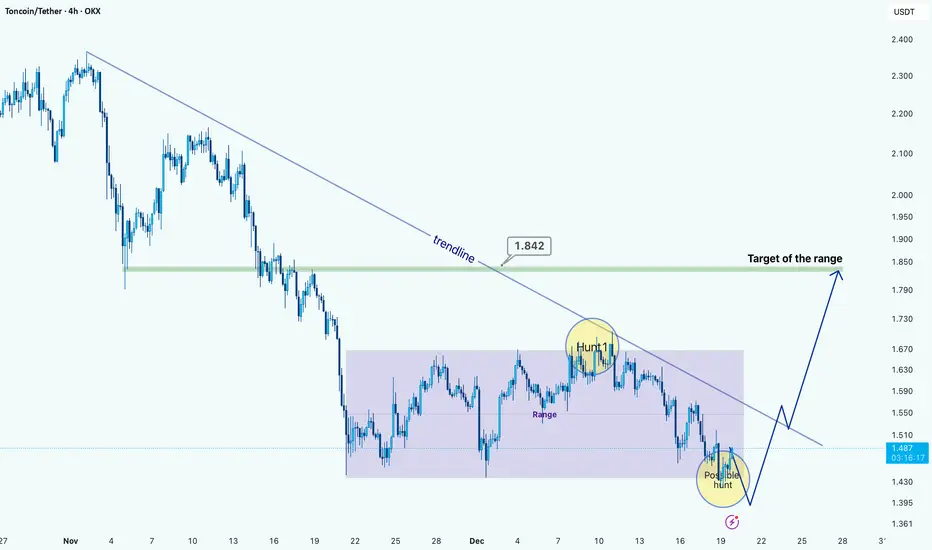
TON is still trading under a well-defined descending trendline, confirming that the higher-timeframe structure remains bearish. After the impulsive sell-off, the price transitioned into a clear consolidation range, highlighted on the chart. This range shows multiple reactions at both extremes,
Lingrid | TONUSDT Break and Retest Shorting Opportunity OKX:TONUSDT has slipped back below consolidation floor, confirming a loss of balance after repeated failures to reclaim the descending trendline. The latest bounce formed another lower high beneath the red resistance line, signaling that bearish pressure may still be dominant. Price acceptance belo

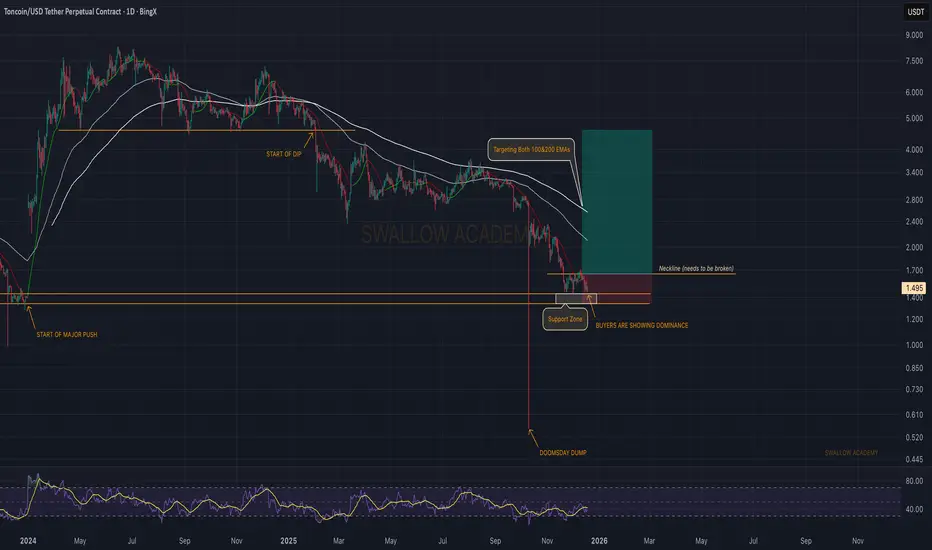
Toncoin (TON): Looking For Break of Neckline | Expecting UP MoveTON is holding the local support zone well and buyers are starting to show dominance again in this area. The reaction from this zone is clean so far, which keeps the bullish idea valid.
Game plan is simple here: we’re waiting for a break of the local neckline. If that neckline gets reclaimed and ac
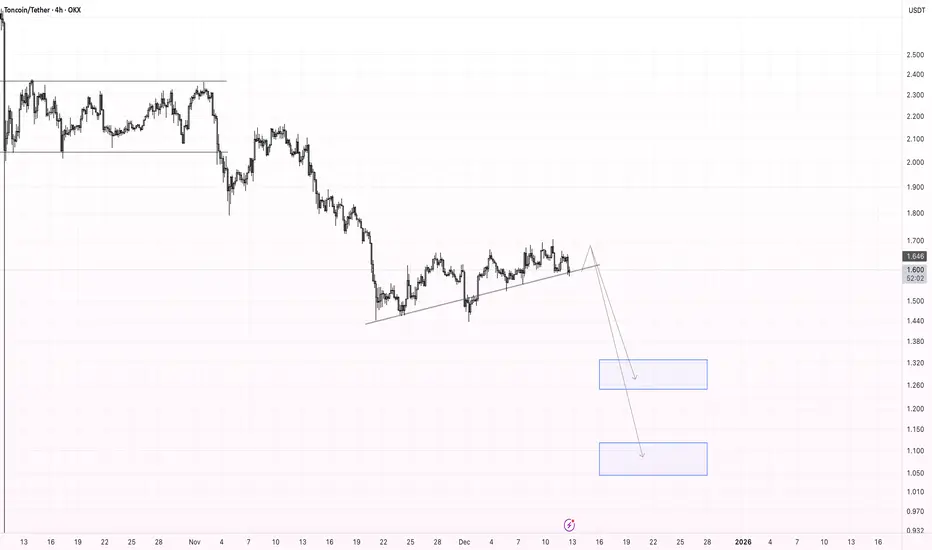
TON Correction Scenario: $1.33 → $1.10 TargetsPrice is breaking below the local ascending trendline, signalling a potential shift in short-term momentum. If the breakdown holds, I expect a continuation to the downside toward the next support zones. My targets are $1.33 as the first demand area and $1.10 as the secondary, deeper target.
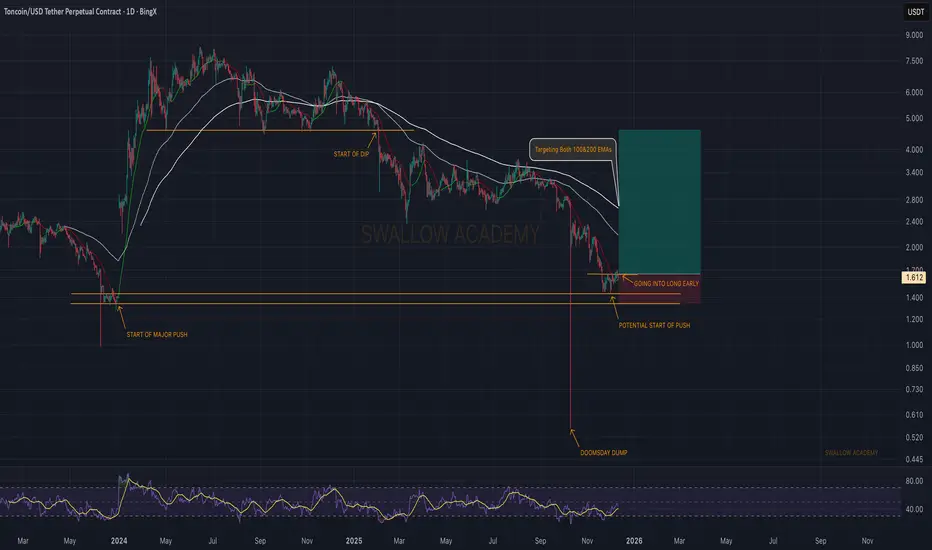
Toncoin (TON): Getting Into Early Long Here | Bullish SetupTON is trying to build a local bottom after that sharp flush, and buyers are starting to show interest around this support zone again. This is the same region where the last major push began, so it naturally attracts reaction.
For the long idea to play out, buyers need to push price back toward the
TON - Long idea.The TON looks pretty long. The structure is good. I expect another test near the local low. Ideally, we should break through the low and rise!
I've sketched out a rough plan and set up alerts. I'll be watching!
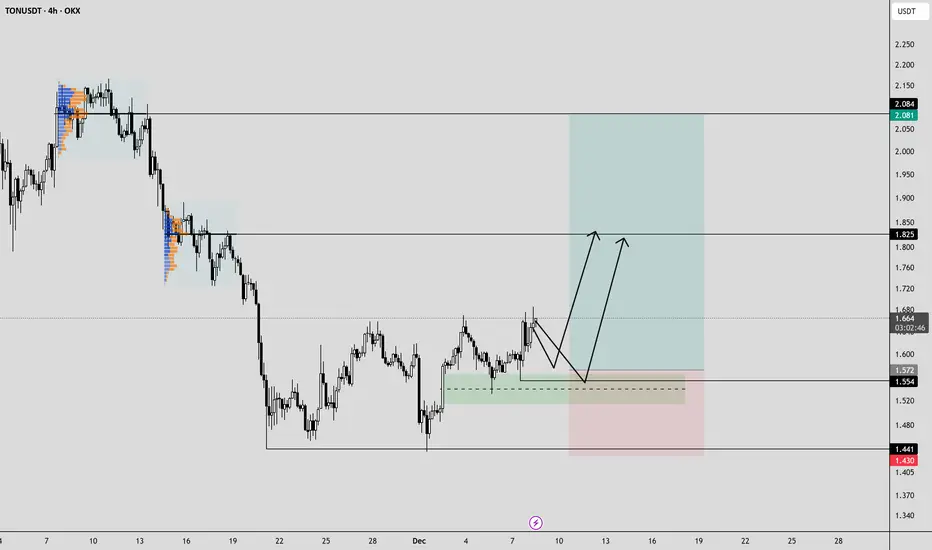
Lingrid | TONUSDT Potential Long During Consolidation PhaseOKX:TONUSDT continues to trade within a consolidating structure, but it's printing a sequence of higher lows while holding above the $1.60 base. The recent pullback found demand near this support region, where buyers stepped back in and defended trend support. Price action suggests the latest dip c

TON . Structure Holding After DistributionTON went through a clear distribution phase after the impulsive move lower, followed by a sharp sell-off that flushed weak hands and triggered stop runs. After that liquidation, price found demand and began forming a base, signaling that sellers were losing control.
Since then, the market has been b

#TON/USDT : Trendline Break & Double Bottom#TON
The price is moving in a descending channel on the 1-hour timeframe. It has reached the lower boundary and is heading towards a breakout, with a retest of the upper boundary expected.
We are seeing a bearish trend in the Relative Strength Index (RSI), which has reached near the lower boundary

The recent impulsive drop broke a key support zonePrice is trading within a clear bearish market structure on the 4H timeframe, with consecutive lower highs and lower lows confirming seller control. The recent impulsive drop broke a key support zone, which is now acting as resistance.
The current pullback into the marked supply area represents a c

See all ideas
Summarizing what the indicators are suggesting.
Oscillators
Neutral
SellBuy
Strong sellStrong buy
Strong sellSellNeutralBuyStrong buy
Oscillators
Neutral
SellBuy
Strong sellStrong buy
Strong sellSellNeutralBuyStrong buy
Summary
Neutral
SellBuy
Strong sellStrong buy
Strong sellSellNeutralBuyStrong buy
Summary
Neutral
SellBuy
Strong sellStrong buy
Strong sellSellNeutralBuyStrong buy
Summary
Neutral
SellBuy
Strong sellStrong buy
Strong sellSellNeutralBuyStrong buy
Moving Averages
Neutral
SellBuy
Strong sellStrong buy
Strong sellSellNeutralBuyStrong buy
Moving Averages
Neutral
SellBuy
Strong sellStrong buy
Strong sellSellNeutralBuyStrong buy
Displays a symbol's price movements over previous years to identify recurring trends.