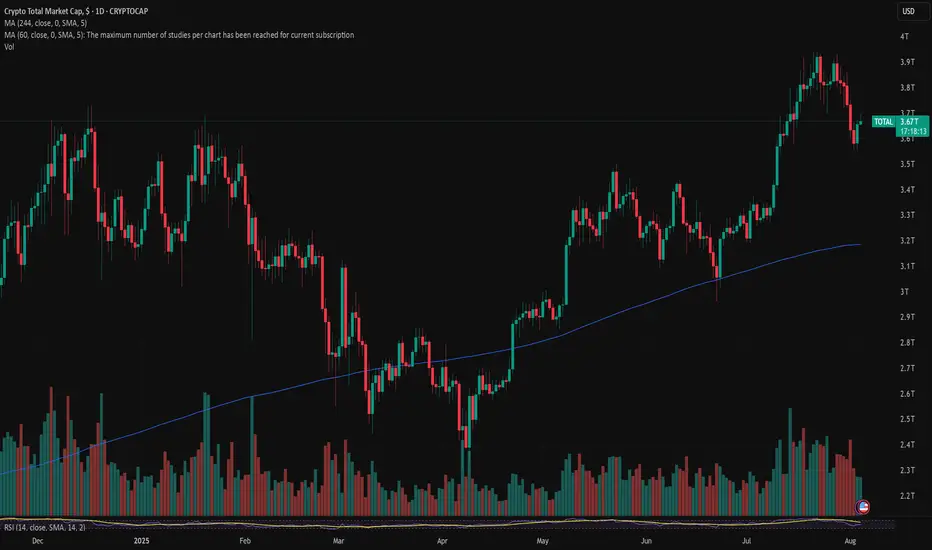
Don’t Panic — It’s Just a Healthy Crypto Correction!While the crypto market has seen some red this week, the bigger picture remains intact. Let’s zoom out and make sense of the current correction.
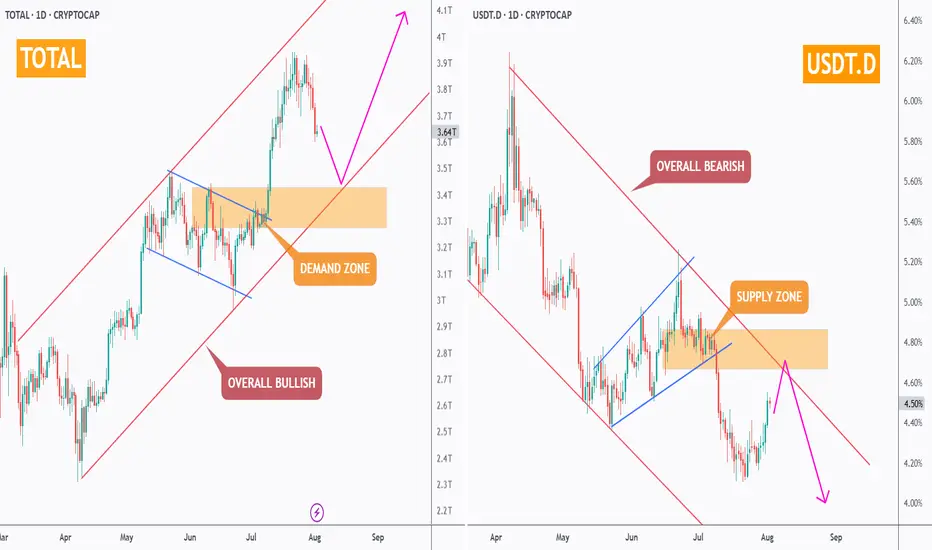
🔸 TOTAL Market Cap (left chart)
The structure remains overall bullish, trading inside the red rising channel.
After a solid rally, the market is curren
Key data points
Previous close
—
Open
—
Day's range
—
About Crypto Total Market Cap, $
A prepared trader is defined by their ability to see a bigger picture of a market. It applies to crypto traders too — if you agree, we've prepared a chart that will let you see the whole crypto market from a bird's-eye view. It shows total crypto market cap, which is calculated by TradingView by adding up top 125 coins market caps, which, in their turn, are the number of coins times their current price. A growing market cap can indicate investors' interest and their positive evaluation of the current market state. For you it might be a good indicator of where the wind blows and whether digital coins are a good investment tool.
Crypto Market Slows Down For A Pullback Within A Bullish TrendGood morning Crypto traders! Cryptocurrencies are coming slightly lower on the intraday basis due to stock market decline yesterday, but we still see them approaching support, so still be aware of a bounce and recovery at the end of the week or maybe next week because of an upcoming weekend. Crypto

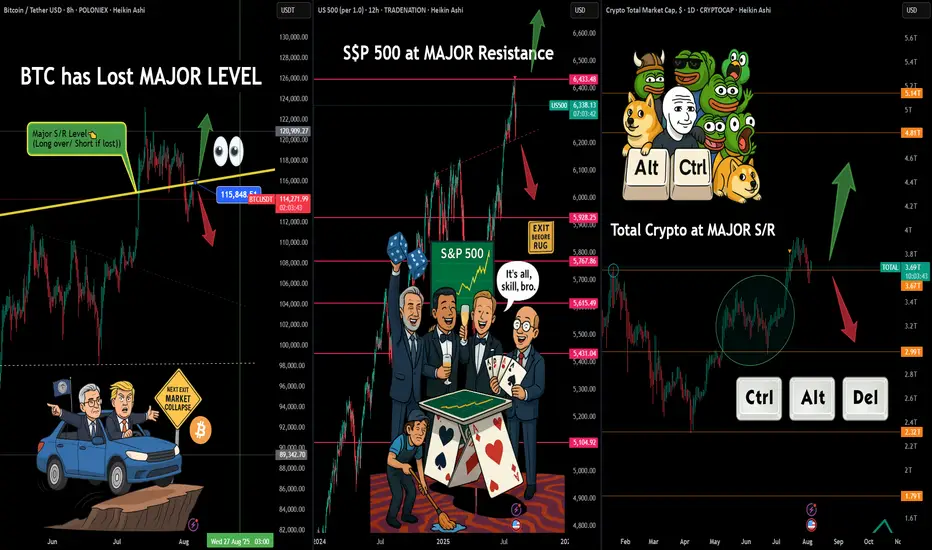
Alt-Season or Alt-Control-Delete.?🤖💣 Alt-Season or Alt-Control-Delete.? 🧠📉
The market looks like it's a bout to rug someone... and it might just be Trump.
While President Trump narrows down his Fed Chair shortlist, the real driver — Powell — is still at the wheel. But the car? It's swerving dangerously near the edge. BTC has
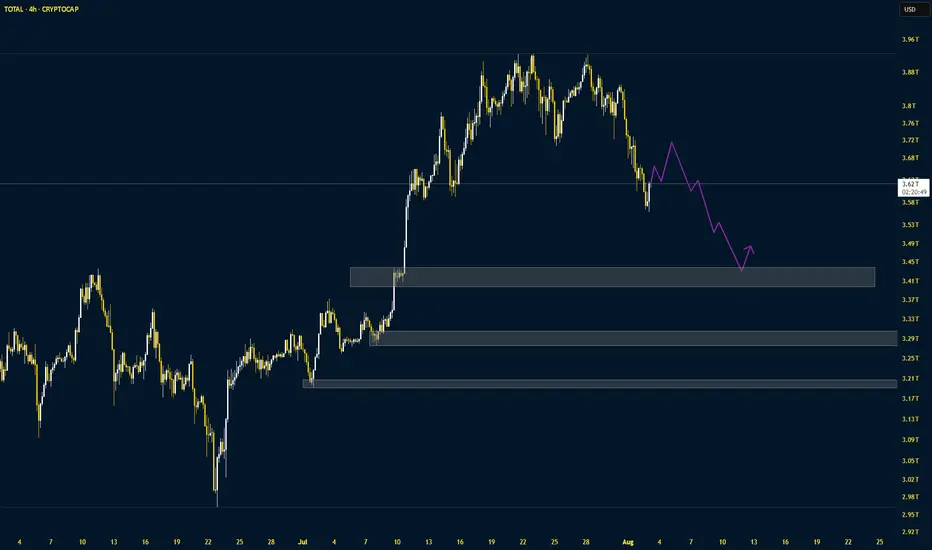
Short Term Crypto Total Market CapHere are the 2 scenarios which I can imagine for the short-term move of the crypto market with respective invalidation levels and trade ideas.

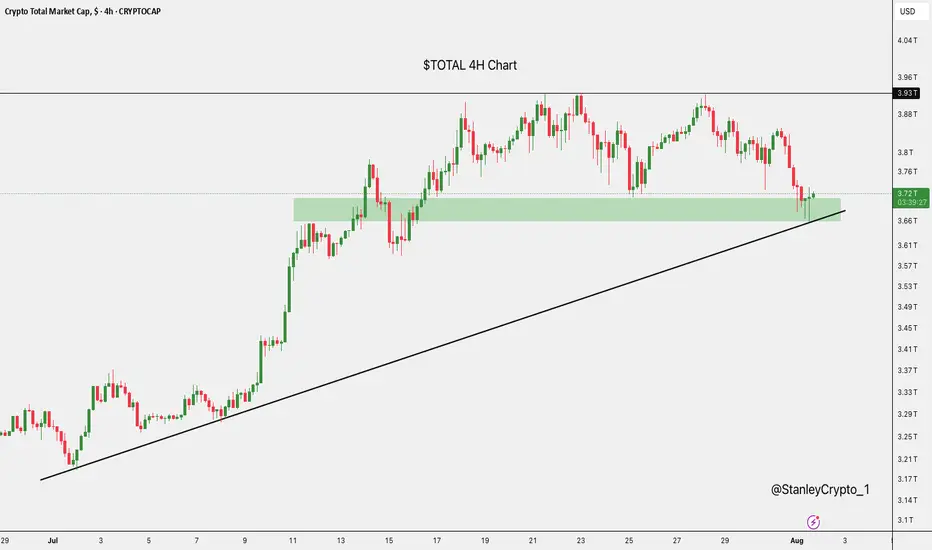
$TOTAL at Key SupportThe crypto market cap has just bounced off a strong support zone around $3.67T, right where it aligns with the rising trendline.
This area has held firm before, and it's doing the same now.
If it continues to hold, we could see a nice recovery.
But if it breaks down, there’s a risk of more downsi
Crypto Total Market CapThe market is correcting at a very fast pace. The correction pattern could be 5-3-5. The following supports are important
ETH and TOTAL Short Term Profit OpportunityETH TOTAL
ETH wicked into higher liquidity above the previous peak just as TOTAL hit the sweet spot just below 0.85 (for retracement completion).
So, if you're into the short term game, then this is a great moment to take some profit on ETH.
Even if it goes higher there are decent odds that it wi

Money Flow - 2### Money Flow Spread from DJI to Cryptocurrency: A Fibonacci Perspective
The financial markets operate in an interconnected ecosystem where capital flows between asset classes based on macroeconomic trends, investor sentiment, and risk appetite. One such dynamic involves the movement of funds from

MARKETS week ahead: August 4 – 10Last week in the news
US macroeconomic data took center stage during the previous week, with major correction occurring on Friday, after the NFP July data were released. Investors fear of economic consequences of implementing trade tariffs pushed US equity markets to downside. The S&P 500 lost 1,5%
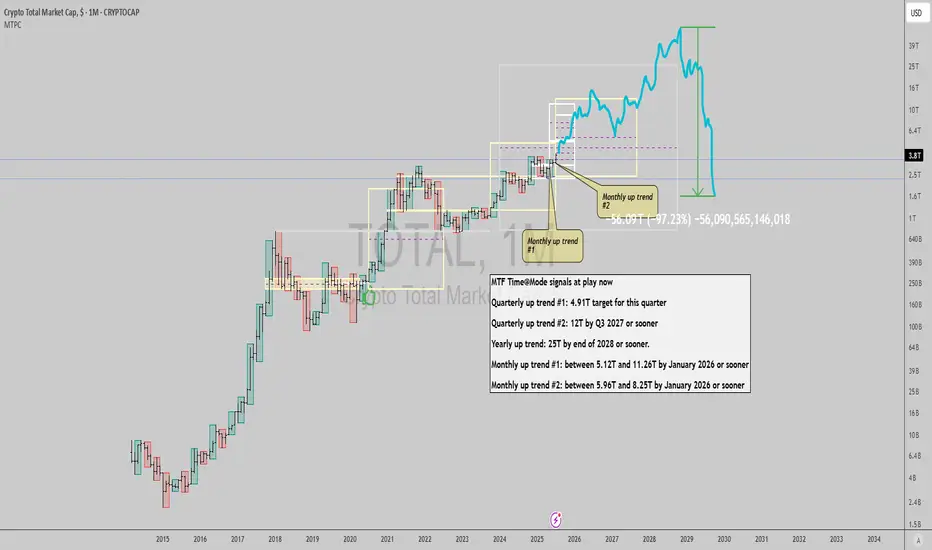
$TOTAL: Crypto market signals long term upside pendingGM gents, most people in crypto circles (Crypto Twitter sphere of influence and former Tradingview posters who evolved into influencers there) seem to have the consensus view that the market has little time to rise from here, and appear to signal a wall of worry sentiment.
This resonates with varia
See all ideas
Summarizing what the indicators are suggesting.
Oscillators
Neutral
SellBuy
Strong sellStrong buy
Strong sellSellNeutralBuyStrong buy
Oscillators
Neutral
SellBuy
Strong sellStrong buy
Strong sellSellNeutralBuyStrong buy
Summary
Neutral
SellBuy
Strong sellStrong buy
Strong sellSellNeutralBuyStrong buy
Summary
Neutral
SellBuy
Strong sellStrong buy
Strong sellSellNeutralBuyStrong buy
Summary
Neutral
SellBuy
Strong sellStrong buy
Strong sellSellNeutralBuyStrong buy
Moving Averages
Neutral
SellBuy
Strong sellStrong buy
Strong sellSellNeutralBuyStrong buy
Moving Averages
Neutral
SellBuy
Strong sellStrong buy
Strong sellSellNeutralBuyStrong buy
Displays a symbol's price movements over previous years to identify recurring trends.