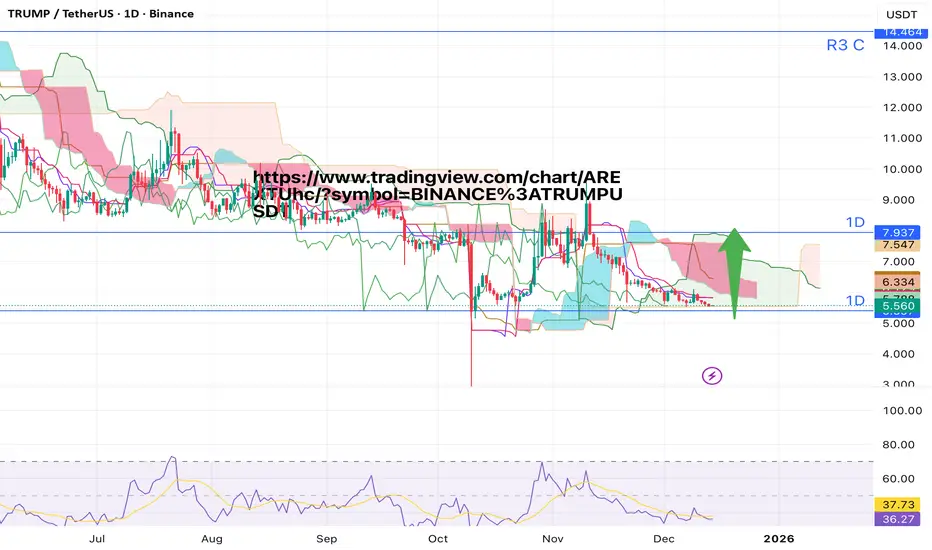
TRUMP more correction awaits 12% at least toward 5$ Hi the support and resistances on the chart are based on the previous data and weekly candlesticks if BINANCE:TRUMPUSDT lost this last support and the green trendline the potential of 12% correction to the downside is logical toward 5$
Market insights

Trump Possible Bottom on 1D & 3D Cloud Structure- I'm just noticed we literally testing the 1st ever cloud support for Trump Coin1D chart (since it's been released).
I also noticed if you look at the 3D with long term and short term settings it's also sitting right on its first ever 3D support line.
www.tradingview.com
TRUMP/USDT — Market StructureAfter the October flash crash, price bounced into resistance, where a bearish divergence formed.
It is now playing out cleanly, and the downtrend continues.
The only meaningful bullish argument at the moment is a large falling wedge on the weekly chart (after removing noise).
Given the memecoin nature of TRUMP, the pattern has a chance to play out — but confirmation is required.
Long entries should be considered only after a clear reversal setup forms.
The 7.5–10$ range holds the main traded volume — this is the primary resistance block and the first major zone to offload positions.
Only a sustained break above this range would open the way toward higher targets.

TRUMP$TRUMP has returned to the bottom of the range and the structure now clearly shows a double bottom pattern. In my view $TRUMP will perform well from here. I am DCAing into my position and this zone looks like a strong entry for anyone looking to position before the next leg up.

TRUMP Coin Still Looks Bearish (1D)It seems to be in a triple correction, and we are currently in the second X wave. The first part was a symmetrical pattern and the second part was a zigzag, and now after the second X wave, the third correction will appear.
Each correction has been strong and has caused an 80–90% price retracement, and the third part, the Z wave, can also create a deep correction.
To enter a position on the hourly timeframes, you need confirmation and triggers. It appears there are many sell orders in the red zone.
A daily candle closing above the invalidation level will invalidate this analysis.
For risk management, please don't forget stop loss and capital management
When we reach the first target, save some profit and then change the stop to entry
Comment if you have any questions
Thank You

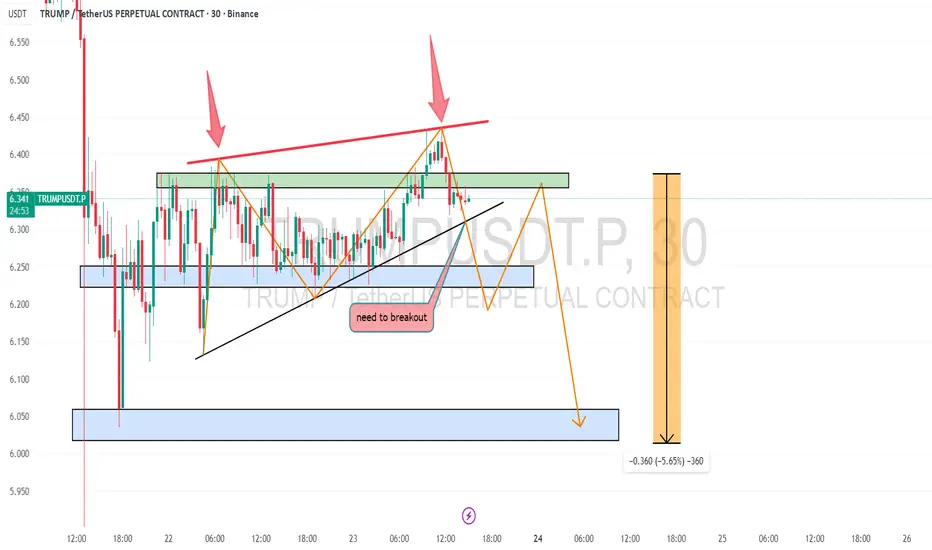
$TRUMP 30 MINUTS CHART UPDATE 📌$TRUMP 30 Minutes chart shows a rising wedge pattern ✅
📌 It has not yet broken out ✅
📌 It has been rejected by the red trend line several times ✅
📌If this continues to reject the red trend line, and breaks down, the price will fall further 🚀🔥
LongAccording to the analysis of the waves and the help of the Gann method, it can be expected that the price will return to the green zone again.
This is my personal opinion. Please don't use it as your trading criteria. Good luck

TRUMP Update📊 TRUMP Update
TRUMP has broken out above the blue support zone 🔵 and reached its first target level ✅

OFFICIAL TRUMP Goes Solo as It Approaches 2025 EndOFFICIAL TRUMP has been trading within an ascending wedge for the past two and a half weeks, sitting at $7.86. This chart formation is typically a bearish signal, often preceding downward moves.
If bearish factors persist, TRUMP could break below its current threshold. Weak buying pressure may drive a 19% decline toward the $6.24 support level.
Alternatively, if the CMF pattern holds, TRUMP could bounce off the lower trend line and surge past $8.36 to test $9.00. While this move would invalidate the short-term bearish outlook, the broader downtrend is still intact.

TRUMP Update📊 TRUMP Update
TRUMP is testing the blue support level 🔵
If it breaks below, it could confirm a bearish setup 📉
The first short target would be the green line level 🟢

TRUMP$TRUMP has rallied 500% from its bottom and still shows momentum for another potential 500% upside from current levels. Market sentiment remains strong as it represents the personal meme coin tied to the President of the United States, fueling speculative demand.

Trump on the JumpHi friends! How’s your week starting? 🌞
In one of my recent posts, I shared a bearish view on the Trump coin — but the price has broken above my invalidation zone, so that idea has been closed.
Right now, the chart looks more bullish, and I’m watching for a possible continuation to the upside.
🎯 My current targets are around 9.06.
❌ The plan will be invalidated if the price reaches the red zone - 8,123
⚠️ Remember — never trade without stop-losses.
If you enjoy my updates and want to get daily analysis on this coin, make sure to:
💬 leave a comment,
❤️ react to the post,
🔔 and follow me for more regular insights!

Trump Dump? Chart Looks Like a BumpIn my view, TRUMP is currently showing a very similar structure to what we recently saw on DASH before its sharp drop.
The charts look almost identical, and this resemblance makes me cautious here.
🎯 Target: 6.9
❌ Invalidation Level: 7.587
If this pattern plays out the same way, we could see another strong move down from the current levels.
⚠️ Disclaimer: This is just my personal market view, not financial advice. Always trade with stop-losses — never without them!
💬 Drop a reaction or comment, and follow if you’d like to see my next updates on TRUMP! 🚀

TRUMP-USDTAfter a sweep into the capitulation zone below the April lows, the price has returned to the resistance area of the descending channel. A classic range breakdown–retest structure is forming, with price now consolidating within the resistance zone — a typical accumulation phase before a potential breakout.
Further movement may turn into an impulse, depending on the broader market context — either breaking out of the channel or retesting lower levels once more.
📊 Watch the price reaction in this zone — it will define the next medium-term move.

XAUUSD NEW OUTLOOK According to H1 analysis gold market running in sell pressure now market almost at residence level so it's a best chance to go short from RESISTANCE LEVEL Don't be greedy use money management
TRADE AT YOUR OWN RISK
REGARD ALBERT

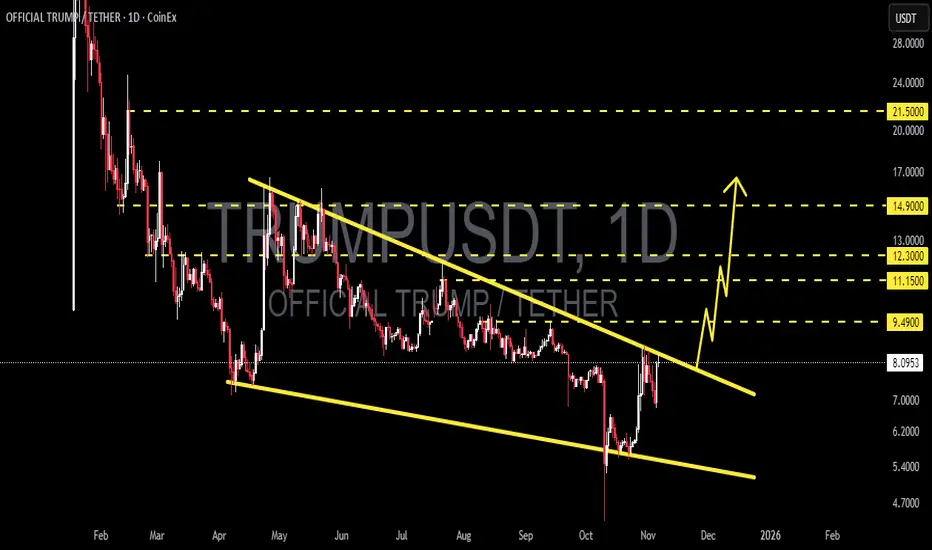
TRUMP/USDT — Descending Wedge on the Edge of Breakout?After a prolonged downtrend since mid-year, TRUMP/USDT is now showing one of the most exciting technical formations: a Descending Wedge, gradually tightening — a classic pattern that often precedes a major bullish reversal.
The price is currently hovering around $8.1, sitting just below the descending wedge resistance that has capped every rally for months. This structure suggests that selling pressure is weakening, while a potential breakout could be on the horizon if the market confirms a close above this trendline.
---
📈 Bullish Scenario — Breakout and Trend Reversal
A confirmed daily close above the wedge resistance could trigger a strong momentum shift, potentially marking the start of a new uptrend.
Key upside targets to watch:
TP1: $9.49 (initial breakout confirmation)
TP2: $11.15
TP3: $12.30
Extended targets: $14.90 — $21.50 if bullish sentiment accelerates
Additional confirmation may come from increasing volume, a strong bullish candle, or a successful retest of the breakout zone.
---
📉 Bearish Scenario — Rejection and Retest of Lower Support
If the price faces rejection from the wedge resistance once again, a pullback toward the lower wedge support around $6.0–5.4 could follow.
A clean breakdown below that zone would open the path to $4.7, the next significant demand area.
As long as price remains inside the wedge, however, the potential for a bullish reversal remains valid.
---
📊 Pattern Interpretation
The Descending Wedge pattern typically signals bullish reversal potential.
Each test of the lower boundary has produced a stronger recovery.
The wedge range is tightening — often a precursor to a volatility expansion.
Market sentiment remains neutral-to-bullish, awaiting a confirmed breakout candle.
---
💡 Conclusion
TRUMP/USDT is now sitting at a make-or-break zone.
A decisive breakout above the descending wedge could spark a significant trend reversal, while another rejection might extend consolidation a bit longer before the real move begins.
With volatility compressing and structure tightening, this setup might just be the calm before the storm — and whichever direction breaks next could define the trend for the rest of the quarter.
---
#TRUMPUSDT #TRUMP #CryptoAnalysis #DescendingWedge #BreakoutSetup #TechnicalAnalysis #CryptoTrading #BullishPattern #AltcoinAnalysis #ChartSetup #CryptoMarket #ReversalPattern #PriceAction
TRUMP : SIGNALHello friends
Given the good growth we had and the entry of buyers, now that the price is correcting and a double bottom pattern has formed, there is a good opportunity to buy with risk and capital management and move towards the specified goals.
*Trade safely with us*

TrumpusdtAnalysis of the Trump/USD pair on the hourly timeframe, based on trend analysis and support and resistance levels

TRUMPUSDT.P - November 4, 2025TRUMPUSDT.P is attempting a bullish reversal after establishing a potential higher low near the $7.02–$6.95 support zone. Price is consolidating around the $7.27 buy limit area, indicating early accumulation before a possible push higher toward the $7.73–$7.83 target zone. The structure suggests a corrective pullback within a broader attempt to regain bullish momentum, with confirmation requiring a breakout and sustained move above $7.49.
Risk Assessment: Moderate risk — bullish momentum is developing from a potential base, but price remains within a short-term consolidation phase. Maintaining support above $7.02 is crucial to sustain upward momentum and confirm the reversal structure.

TRUMP Token Ecosystem Expanding – Real Utility Incoming(+30%)?The Official Trump ( BINANCE:TRUMPUSDT ) token has recently shown strong resilience and even outperformed the broader crypto market — and there are several interconnected reasons behind this momentum :
1. Whale Accumulation and Investor Confidence
Large holders have increased their TRUMP balances from roughly 3.97M to 4.88M tokens. This accumulation suggests renewed confidence and long-term positioning by influential investors, providing a strong base of support.
2. Expansion of the Trump Crypto Ecosystem
The ecosystem around Trump-linked assets is growing:
World Liberty Financial, connected to the Trump family, announced a distribution of 8.4M WLFI tokens to users of its USD1 stablecoin on the Enso blockchain.
This strengthens cross-project connectivity and gives TRUMP indirect exposure to new on-chain activity and liquidity.
3. Strategic Business Moves
The TRUMP token issuer, Fight Fight Fight LLC, is reportedly in talks to acquire the U.S. operations of Republic, a regulated investment and crowdfunding platform.
If completed, this deal could:
Add real utility to TRUMP (e.g., payments, fundraising, platform fees).
Expand adoption beyond speculation.
Reinforce the token’s legitimacy within U.S. financial infrastructure.
Summary
While the broader crypto market has dipped, TRUMP is supported by:
Whale accumulation,
Expanding ecosystem ties,
A potential acquisition bringing real-world utility, and
These factors together explain why the TRUMP token could continue to rise — or at least remain relatively strong — even in a weakening crypto environment.
-------------------------------------------------------
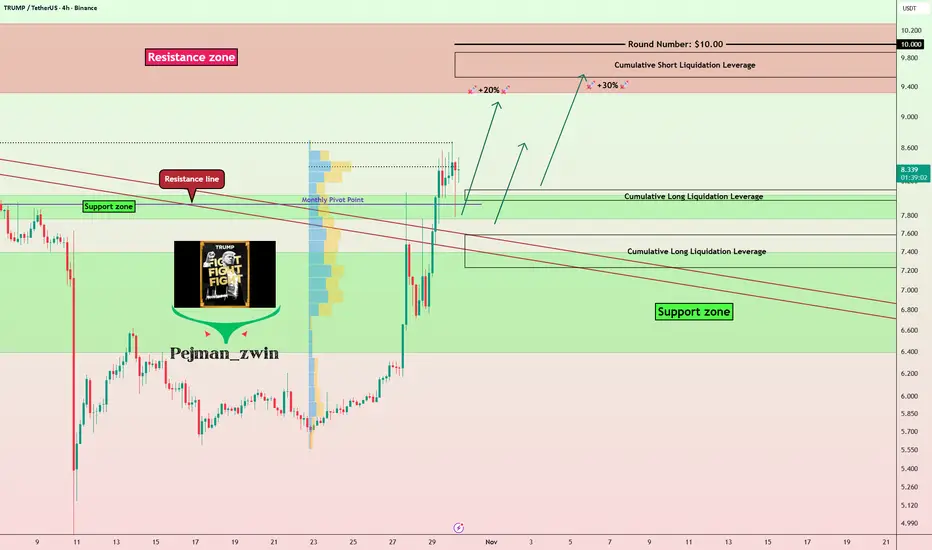
After reviewing the recent news around the TRUMP token , let's take a look at its 4-hour time frame chart.
Currently, the TRUMP token has successfully broken through its Resistance lines with strong momentum and is now moving near a Support zone($8.30-$7.76) and a Cumulative Long Liquidation Leverage($8.10-$7.97) .
I expect that even if the crypto market and Bitcoin ( BINANCE:BTCUSDT ) experience some decline, the TRUMP token might be able to hold its ground thanks to the positive news and the strong momentum it showed when breaking those resistance lines. We could see it potentially rise another +20%/+30% and reach its next Resistance zone($10.30-$9.32) .
Note: A key price level to watch for TRUMP is around $8.70, which has served as both strong support and resistance over the past few months and has been notable in terms of trading volume.
Stop Loss(SL): $7.19(Worst)
Cumulative Long Liquidation Leverage: $7.58-$7.23
Cumulative Short Liquidation Leverage: $9.88-$9.53
Please respect each other's ideas and express them politely if you agree or disagree.
OFFICIAL TRUMP Analyze (TRUMPUSDT), 4-hour time frame.
Be sure to follow the updated ideas.
Do not forget to put a Stop loss for your positions (For every position you want to open).
Please follow your strategy and updates; this is just my Idea, and I will gladly see your ideas in this post.
Please do not forget the ✅' like '✅ button 🙏😊 & Share it with your friends; thanks, and Trade safe.
Trump ore gain after huge falling 25% gain toward 9.80$Hi the support and resistances on the chart are based on the previous data and weekly candlesticks if BINANCE:TRUMPUSDT holds this last support the potential of 25% gain is logical toward 9.80$

Trump after unlivable dump now it is time to shine 33% gain to 8Hi the support and resistances on the chart are based on the previous data and weekly candlesticks if BINANCE:TRUMPUSDT holds this last support the potential of 33% gain is logical toward 8.40$

TRUMPUSDT.P - November 1, 2025TRUMPUSDT.P is showing a strong bullish reversal from a higher low structure, supported by a breakout and sustained momentum. The long setup targets the $11.219 profit level, with a stop positioned at $5.355 for clear risk control. A move beyond the $9.000 zone would validate bullish continuation, prompting a shift of the stop to breakeven. Price action remains constructive while holding above the ascending support trendline.
