Lingrid | TRXUSDT Flag Pattern Breakdown Continuation SetupBINANCE:TRXUSDT perfectly played out my previous trading idea . Price lost its bullish continuation after price slipped below the trendline and failed to hold the flag structure. The recent lower high confirms weakening demand, while the break beneath the mid-range support signals a transition fro

TRXUSDT Chart Analysis 12-Dec-25Stop Loss: 0.2706
Buy Stop: 0.3015
Take Profit 1: 0.3333
Take Profit 2: 0.3645
A Falling Wedge pattern has formed within the recent bearish structure, accompanied by a clear bullish RSI divergence, indicating a potential trend reversal. If the price breaks above the Buy Stop level at 0.3015, it may

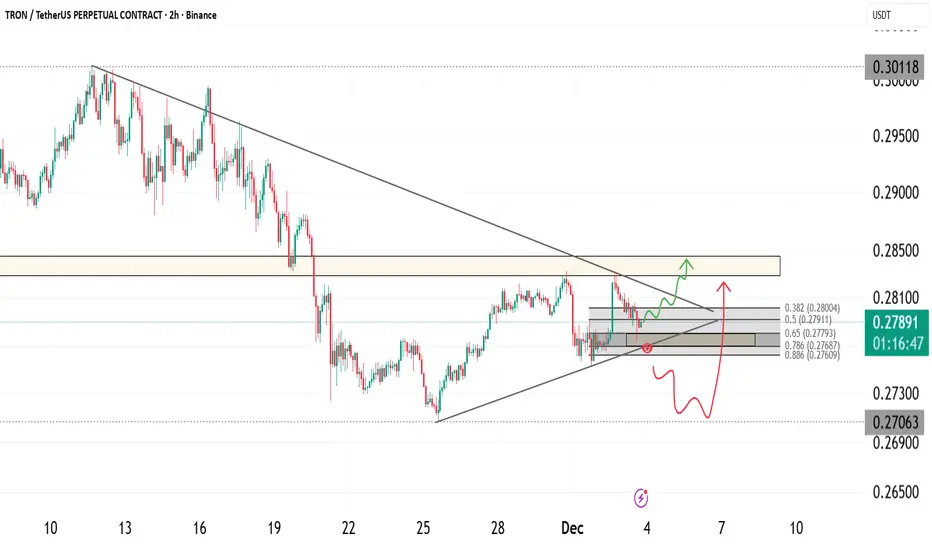
TRX Breakdown Incoming? This Trendline Retest Could Be the FinalYello Paradisers, could this be the final warning before #TRX breaks down completely? Or is the market setting up for a savage fakeout that will trap late sellers and then rip higher?
💎#TRXUSDT is currently retesting the ascending trendline after pulling back from the supply zone around $0.2820, a

The key is whether it can rise above 0.2851
Hello, fellow traders!
Follow us to get the latest information quickly.
Have a great day.
-------------------------------------
(TRXUSDT 1M Chart)
From a long-term perspective, the price needs to remain above 0.18-0.2011 to continue the uptrend.
If it encounters resistance at 0.2851 and declin

TRXUSDT 1D#TRX has broken above the falling wedge on the daily chart. The RSI and MACD both suggest continued upward momentum, but for now, #TRX is facing the daily SMA50. In case of a breakout above the SMA50, the potential targets are:
🎯 $0.3075
🎯 $0.3188
🎯 $0.3301
🎯 $0.3462
🎯 $0.3667
⚠️ Always remember t

TRX Approaching Key Breakout Zone as Structure TightensTRX is approaching a critical decision point inside a compressing structure where price is being held between diagonal resistance and a rising support line. The market has printed a clean series of higher lows while repeatedly testing the same resistance, suggesting growing pressure beneath the pri
TRON Price Analysis: TRX Returns to a Key Zone – What's Next* TRX has actually maintained a strong uptrend line, which has protected it against various dips over the past year.
* Activity on TRX stays stable despite being close to a critical level of support.
* Should the current level of support hold, a move to the region of $0.30-$0.32 is possible.
Wh

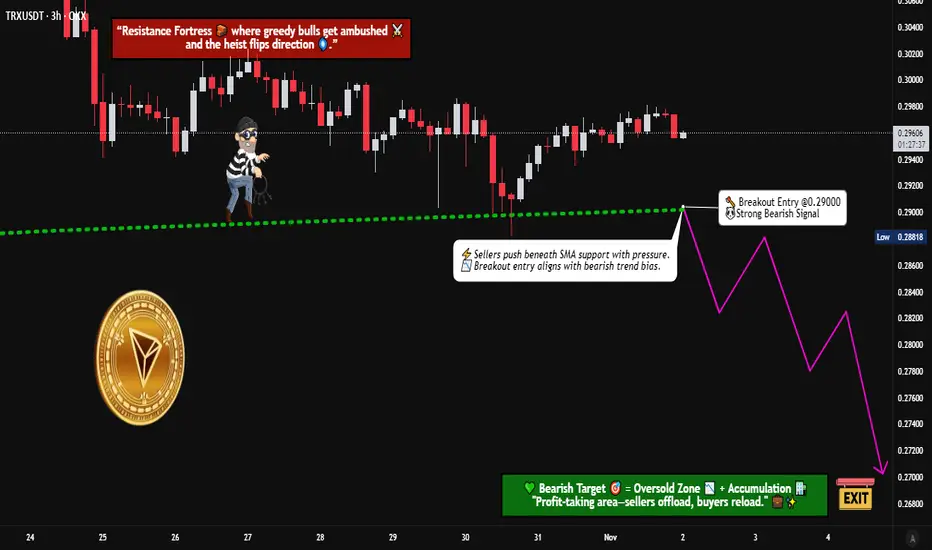
TRON Short Strategy – Breakout Signal or False Alarm?💥 TRX/USDT "TRON vs TETHER" Crypto Market Profit Playbook (Day Trade) 💥
🧭 Idea: Bearish Market Flow Strategy
🔻 Plan Overview
This setup focuses on a bearish momentum play following a moving average breakout confirmation. TRON is showing weakness under key resistance, signaling potential for a short
TRX: Bullish with high confidenceHey guys, let's break down what's happening with Tron on the 1-hour timeframe because we're seeing some textbook oversold conditions that could set up a solid mean reversion play.
TRX is currently trading at $0.2772, down 1.29% over the last 24 hours and sitting dangerously close to the daily low a

TRX/USDT — Long-Term Trendline Test: Bounce or Breakdown?TRX has maintained a multi-year higher-high, higher-low structure, making it one of the most stable altcoins in a volatile market cycle. But now, price is sitting directly above the primary ascending trendline — the same trendline that has supported TRX’s entire bullish expansion since early 2023.

See all ideas
Summarizing what the indicators are suggesting.
Oscillators
Neutral
SellBuy
Strong sellStrong buy
Strong sellSellNeutralBuyStrong buy
Oscillators
Neutral
SellBuy
Strong sellStrong buy
Strong sellSellNeutralBuyStrong buy
Summary
Neutral
SellBuy
Strong sellStrong buy
Strong sellSellNeutralBuyStrong buy
Summary
Neutral
SellBuy
Strong sellStrong buy
Strong sellSellNeutralBuyStrong buy
Summary
Neutral
SellBuy
Strong sellStrong buy
Strong sellSellNeutralBuyStrong buy
Moving Averages
Neutral
SellBuy
Strong sellStrong buy
Strong sellSellNeutralBuyStrong buy
Moving Averages
Neutral
SellBuy
Strong sellStrong buy
Strong sellSellNeutralBuyStrong buy
Displays a symbol's price movements over previous years to identify recurring trends.