TRXUSDT – 4H Chart Update & Analysis. TRXUSDT – 4H Chart Update & Analysis
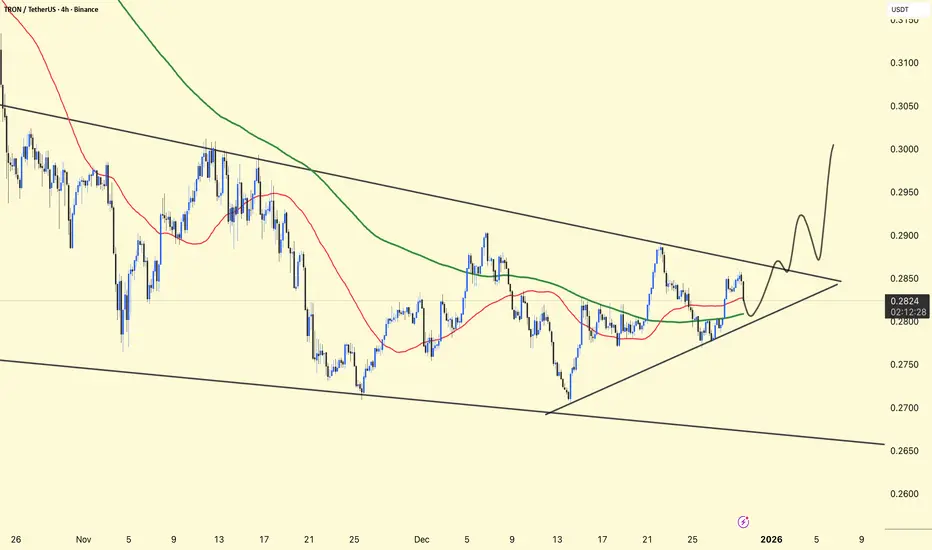
Price is compressing inside a descending broad channel with a short-term ascending triangle forming → volatility squeeze near the apex.
Price is hovering around the 50 MA
Immediate Support: 0.278 – 0.275
Major Support: 0.268 – 0.265
Resistance: 0.285 – 0.288
Br
Related pairs
TRX TRON Technical Analysis and Trade Idea I’m currently watching TRX / TRON 👀💎.
We can clearly see bullish price action developing on both the Daily and 4H timeframes 📈🔥, which keeps TRX firmly on my radar for a potential buy setup.
That said, I’m not chasing price — I have specific conditions that need to be met ✅📊:
🔹 Scenario 1 – Pullba

Lingrid | TRXUSDT Complex Pullback Creates Short OpportunityBINANCE:TRXUSDT is struggling to push beyond the 0.290 resistance, where price just printed another lower high against the descending trendline. The rebound from the support area looks corrective rather than impulsive, while bearish momentum remains dominant within the broader downward structure. T

$TRX 4H CHART UPDATE 📌The CRYPTOCAP:TRX 4H CHART shows a short-term price increase ✅ According to Elliott waves, it is currently forming the 4th wave.✅
📌 If the 4th wave does not break out of the support zone below and ends above it, the price may rise again 💣🔥

TRX Finds Support and Transitions Into Range StabilizationTRX experienced a controlled pullback into a key support area, where downside momentum stalled and buyers stepped in decisively. The reaction from this zone was clean, indicating absorption rather than continuation lower after the corrective phase.
Following the bounce, price has transitioned into

$TRX Coiling for Launch: Breakout Loading..TRX/USDT is ranging tightly between $0.22–$0.26, building pressure for a breakout. Price is still above the 100-day EMA, hinting at bullish bias. A confirmed breakout above $0.26 could fuel a rally toward;
$0.282, $0.32, $0.37, and $0.43 (+66%). However, losing the range support risks more sideways

DeGRAM | TRXUSD is correcting📊 Technical Analysis
● TRX/USD is trading near the upper boundary of an ascending channel, repeatedly rejecting the 0.286–0.288 resistance zone. Multiple bearish reactions from this trendline highlight seller dominance at highs.
● Price failed to hold above the local resistance and is forming lowe

TRX / USDT PERP – 4H Trade IdeaTRX is currently trading below a bearish order block, after a clear market structure break (MSB) to the downside.
🔴 Short bias
Rejection from bearish OB
MSB confirmed
No bullish displacement yet
Short idea
Entry: rejection at current OB zone
Invalidation: clean 4H close above the OB high
Targets

Tron (TRX): The Coin Thats Been Too Pushy | Time To Sell?TRX has been heavily overperforming for a long time, basically just grinding higher without a proper reset. Now we’re seeing a clear breakdown of the trend that has been respected for months, with price getting rejected near the EMAs.
This looks like a healthy reset phase rather than anything else.

TRX 1D LongThe Three Drives Pattern (TDP) reversal formation has formed, and an upward IOF is emerging.
Rebalancing the bullish inefficiency will provide an excellent opportunity to open a long position. 📈

See all ideas
Summarizing what the indicators are suggesting.
Oscillators
Neutral
SellBuy
Strong sellStrong buy
Strong sellSellNeutralBuyStrong buy
Oscillators
Neutral
SellBuy
Strong sellStrong buy
Strong sellSellNeutralBuyStrong buy
Summary
Neutral
SellBuy
Strong sellStrong buy
Strong sellSellNeutralBuyStrong buy
Summary
Neutral
SellBuy
Strong sellStrong buy
Strong sellSellNeutralBuyStrong buy
Summary
Neutral
SellBuy
Strong sellStrong buy
Strong sellSellNeutralBuyStrong buy
Moving Averages
Neutral
SellBuy
Strong sellStrong buy
Strong sellSellNeutralBuyStrong buy
Moving Averages
Neutral
SellBuy
Strong sellStrong buy
Strong sellSellNeutralBuyStrong buy
Displays a symbol's price movements over previous years to identify recurring trends.
Frequently Asked Questions
The current price of TRON / USDT (TRX) is 0.2887 USDT — it has fallen −0.14% in the past 24 hours. Try placing this info into the context by checking out what coins are also gaining and losing at the moment and seeing TRX price chart.
TRON / USDT price has risen by 2.87% over the last week, its month performance shows a 2.03% increase, and as for the last year, TRON / USDT has increased by 12.77%. See more dynamics on TRX price chart.
Keep track of coins' changes with our Crypto Coins Heatmap.
Keep track of coins' changes with our Crypto Coins Heatmap.
TRON / USDT (TRX) reached its highest price on Dec 4, 2024 — it amounted to 0.4497 USDT. Find more insights on the TRX price chart.
See the list of crypto gainers and choose what best fits your strategy.
See the list of crypto gainers and choose what best fits your strategy.
TRON / USDT (TRX) reached the lowest price of 0.0068 USDT on Mar 13, 2020. View more TRON / USDT dynamics on the price chart.
See the list of crypto losers to find unexpected opportunities.
See the list of crypto losers to find unexpected opportunities.
The safest choice when buying TRX is to go to a well-known crypto exchange. Some of the popular names are Binance, Coinbase, Kraken. But you'll have to find a reliable broker and create an account first. You can trade TRX right from TradingView charts — just choose a broker and connect to your account.
Crypto markets are famous for their volatility, so one should study all the available stats before adding crypto assets to their portfolio. Very often it's technical analysis that comes in handy. We prepared technical ratings for TRON / USDT (TRX): today its technical analysis shows the buy signal, and according to the 1 week rating TRX shows the buy signal. And you'd better dig deeper and study 1 month rating too — it's buy. Find inspiration in TRON / USDT trading ideas and keep track of what's moving crypto markets with our crypto news feed.
TRON / USDT (TRX) is just as reliable as any other crypto asset — this corner of the world market is highly volatile. Today, for instance, TRON / USDT is estimated as 1.55% volatile. The only thing it means is that you must prepare and examine all available information before making a decision. And if you're not sure about TRON / USDT, you can find more inspiration in our curated watchlists.
You can discuss TRON / USDT (TRX) with other users in our public chats, Minds or in the comments to Ideas.