Lingrid | TRXUSDT Flag Pattern Breakdown Continuation SetupBINANCE:TRXUSDT perfectly played out my previous trading idea . Price lost its bullish continuation after price slipped below the trendline and failed to hold the flag structure. The recent lower high confirms weakening demand, while the break beneath the mid-range support signals a transition fro
Related pairs

TRXUSDT Chart Analysis 12-Dec-25Stop Loss: 0.2706
Buy Stop: 0.3015
Take Profit 1: 0.3333
Take Profit 2: 0.3645
A Falling Wedge pattern has formed within the recent bearish structure, accompanied by a clear bullish RSI divergence, indicating a potential trend reversal. If the price breaks above the Buy Stop level at 0.3015, it may

TRXUSDT 1D#TRX has broken above the falling wedge on the daily chart. The RSI and MACD both suggest continued upward momentum, but for now, #TRX is facing the daily SMA50. In case of a breakout above the SMA50, the potential targets are:
🎯 $0.3075
🎯 $0.3188
🎯 $0.3301
🎯 $0.3462
🎯 $0.3667
⚠️ Always remember t

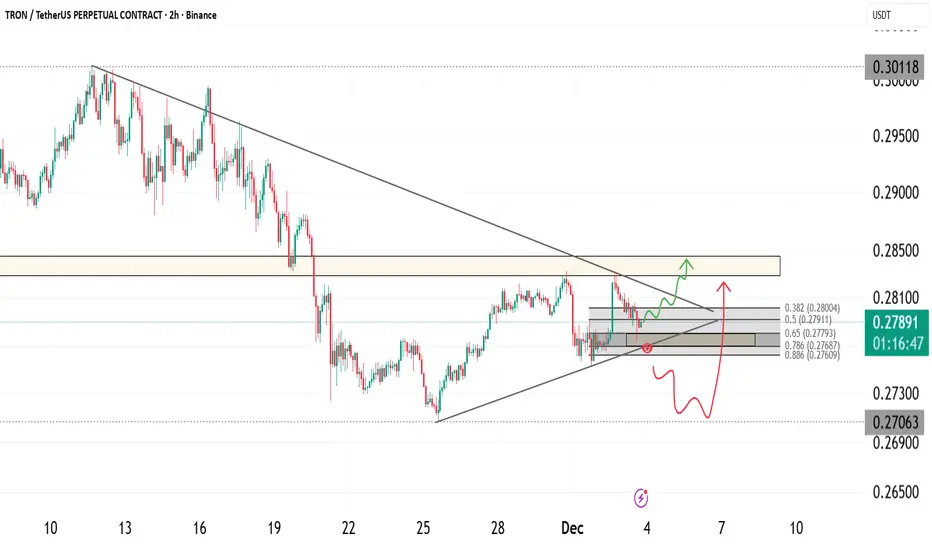
TRX Breakdown Incoming? This Trendline Retest Could Be the FinalYello Paradisers, could this be the final warning before #TRX breaks down completely? Or is the market setting up for a savage fakeout that will trap late sellers and then rip higher?
💎#TRXUSDT is currently retesting the ascending trendline after pulling back from the supply zone around $0.2820, a

The key is whether it can rise above 0.2851
Hello, fellow traders!
Follow us to get the latest information quickly.
Have a great day.
-------------------------------------
(TRXUSDT 1M Chart)
From a long-term perspective, the price needs to remain above 0.18-0.2011 to continue the uptrend.
If it encounters resistance at 0.2851 and declin

TRX Approaching Key Breakout Zone as Structure TightensTRX is approaching a critical decision point inside a compressing structure where price is being held between diagonal resistance and a rising support line. The market has printed a clean series of higher lows while repeatedly testing the same resistance, suggesting growing pressure beneath the pri
TRX: Bullish with high confidenceHey guys, let's break down what's happening with Tron on the 1-hour timeframe because we're seeing some textbook oversold conditions that could set up a solid mean reversion play.
TRX is currently trading at $0.2772, down 1.29% over the last 24 hours and sitting dangerously close to the daily low a

TRX/USDT — Long-Term Trendline Test: Bounce or Breakdown?TRX has maintained a multi-year higher-high, higher-low structure, making it one of the most stable altcoins in a volatile market cycle. But now, price is sitting directly above the primary ascending trendline — the same trendline that has supported TRX’s entire bullish expansion since early 2023.

TRX/USD — Trying to Break the Downtrend TRX/USD has been under pressure since August, losing up to 26%, yet compared to other L1 assets the decline remains relatively mild. Over the past weeks, the pair stabilized around 0.27, forming a minor rebound structure. The key question now: can TRX reclaim its trend, or is this just a relief boun

FireHoseReel | TRX Technical Outlook After Resistance Break🔥 Welcome to FireHoseReel!
Let’s jump into the TRX market structure analysis.
👀 TRX – 4H Overview
TRX has successfully broken above the $0.2824 resistance and is now pushing higher.
Over the past 24 hours, TRX trading volume has dropped by 20%.
📊 Volume Analysis
Watch the volume closely on the cha

See all ideas
Summarizing what the indicators are suggesting.
Oscillators
Neutral
SellBuy
Strong sellStrong buy
Strong sellSellNeutralBuyStrong buy
Oscillators
Neutral
SellBuy
Strong sellStrong buy
Strong sellSellNeutralBuyStrong buy
Summary
Neutral
SellBuy
Strong sellStrong buy
Strong sellSellNeutralBuyStrong buy
Summary
Neutral
SellBuy
Strong sellStrong buy
Strong sellSellNeutralBuyStrong buy
Summary
Neutral
SellBuy
Strong sellStrong buy
Strong sellSellNeutralBuyStrong buy
Moving Averages
Neutral
SellBuy
Strong sellStrong buy
Strong sellSellNeutralBuyStrong buy
Moving Averages
Neutral
SellBuy
Strong sellStrong buy
Strong sellSellNeutralBuyStrong buy
Displays a symbol's price movements over previous years to identify recurring trends.
Frequently Asked Questions
The current price of TRX / USDT Spot Trading Pair (TRX) is 0.2723 USDT — it has risen 0.37% in the past 24 hours. Try placing this info into the context by checking out what coins are also gaining and losing at the moment and seeing TRX price chart.
TRX / USDT Spot Trading Pair price has fallen by −5.58% over the last week, its month performance shows a −6.91% decrease, and as for the last year, TRX / USDT Spot Trading Pair has decreased by −6.43%. See more dynamics on TRX price chart.
Keep track of coins' changes with our Crypto Coins Heatmap.
Keep track of coins' changes with our Crypto Coins Heatmap.
TRX / USDT Spot Trading Pair (TRX) reached its highest price on Dec 3, 2024 — it amounted to 0.4535 USDT. Find more insights on the TRX price chart.
See the list of crypto gainers and choose what best fits your strategy.
See the list of crypto gainers and choose what best fits your strategy.
TRX / USDT Spot Trading Pair (TRX) reached the lowest price of 0.0159 USDT on Jun 29, 2020. View more TRX / USDT Spot Trading Pair dynamics on the price chart.
See the list of crypto losers to find unexpected opportunities.
See the list of crypto losers to find unexpected opportunities.
The safest choice when buying TRX is to go to a well-known crypto exchange. Some of the popular names are Binance, Coinbase, Kraken. But you'll have to find a reliable broker and create an account first. You can trade TRX right from TradingView charts — just choose a broker and connect to your account.
Crypto markets are famous for their volatility, so one should study all the available stats before adding crypto assets to their portfolio. Very often it's technical analysis that comes in handy. We prepared technical ratings for TRX / USDT Spot Trading Pair (TRX): today its technical analysis shows the sell signal, and according to the 1 week rating TRX shows the sell signal. And you'd better dig deeper and study 1 month rating too — it's buy. Find inspiration in TRX / USDT Spot Trading Pair trading ideas and keep track of what's moving crypto markets with our crypto news feed.
TRX / USDT Spot Trading Pair (TRX) is just as reliable as any other crypto asset — this corner of the world market is highly volatile. Today, for instance, TRX / USDT Spot Trading Pair is estimated as 1.22% volatile. The only thing it means is that you must prepare and examine all available information before making a decision. And if you're not sure about TRX / USDT Spot Trading Pair, you can find more inspiration in our curated watchlists.
You can discuss TRX / USDT Spot Trading Pair (TRX) with other users in our public chats, Minds or in the comments to Ideas.