Examples of How to Determine When to Trade
Hello, fellow traders!
Follow us to get the latest information quickly.
Have a great day!
-------------------------------------
How can you profit from trading with charts that show the above movements?
To trade, you need a basic trading strategy.
This basic trading strategy varies from pers
Related pairs
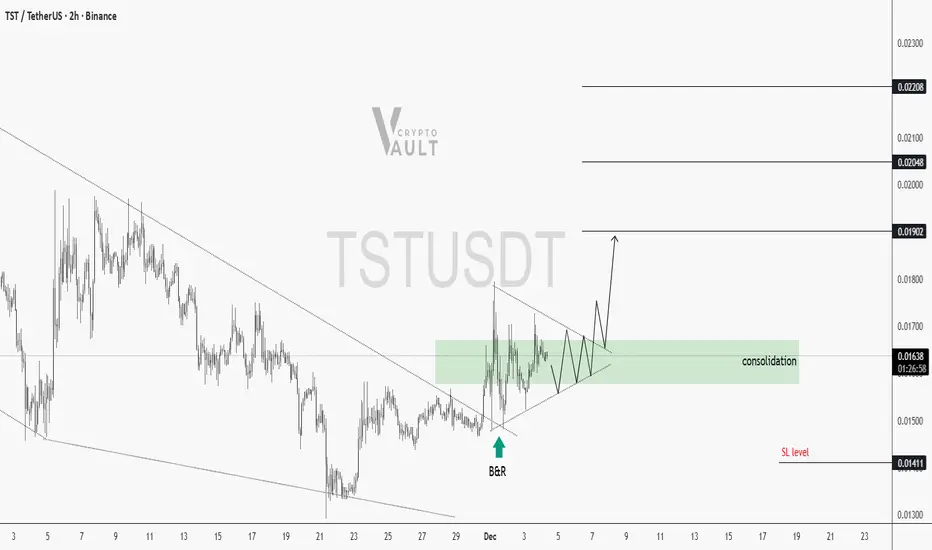
TSTUSDT | This range is loading a movePrice broke out of a descending trendline with a nice Break & Retest (B&R). That strengthen the the shift in structure. Since then, TST is holding inside a consolidation triangle.
As long as price holds this demand block, the market is likely building strength for a continuation move upward.
Upsid
TST REVERSAL LOADINGTST is sitting in strong demand liquidity zone and technicals have also turned Bullish. Use Proper Risk Management

TSTUSDT Forming Falling WedgeTSTUSDT is forming a clear falling wedge pattern, a classic bullish reversal signal that often indicates an upcoming breakout. The price has been consolidating within a narrowing range, suggesting that selling pressure is weakening while buyers are beginning to regain control. With consistent volume

TSTUSDT UPDATE#TST
UPDATE
TST Technical Setup
Pattern: Falling Wedge Pattern
Current Price: $0.0150
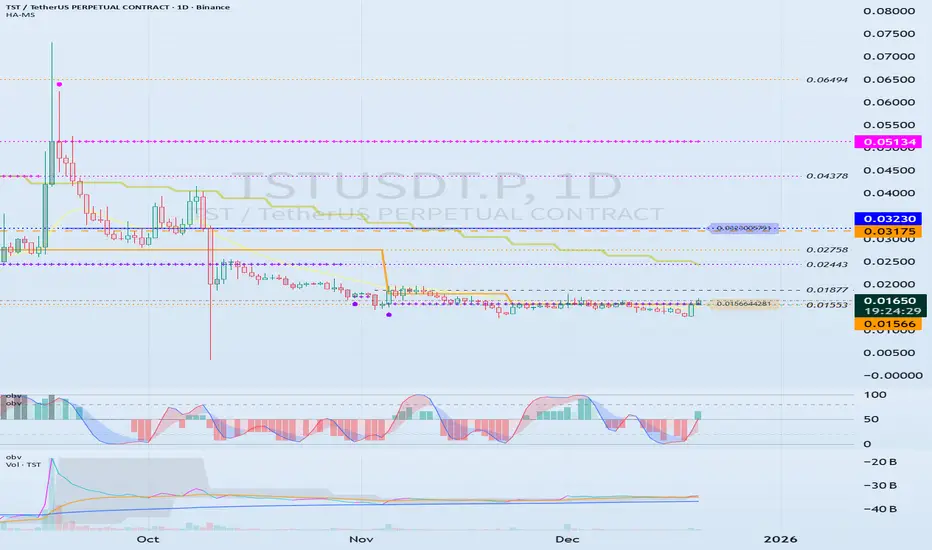
Target Price: $0.0516
Target % Gain: 251.31%
Technical Analysis: TST is breaking out of a falling wedge pattern on the 1D chart, indicating a potential bullish reversal after a prolonged downtrend. Price has c

TSTUSDT 12H#TST is moving inside a falling wedge pattern on the 12H timeframe. Volume has increased, which is a good sign. In case of a breakout above the resistance cluster — consisting of the wedge resistance, the 12H SMA50, and the Ichimoku cloud — the potential targets are:
🎯 $0.01914
🎯 $0.02298
🎯 $0.0260

A look at the longs posted from today's list of potential longsA look at the longs posted from today's list of potential longs using PAR and divergences

TSTUSDTIts a 45 minutes card . 1 day card is also good /
Tst is binance coin . Watch out for ichimouku cloud and resistance level /
It will bring more money and binance has some lag binance takes more high to current price and show you as a loss/but its not real .
Please mention about it in the mail.

Move 3 : Long TST TST long.
Catalyseur : BNB and Aster going up + BTC going up
In : 0.03520
Leverage 15
Obj 1 : sell 80%
Obj 2: sell 20%
Ongoing moves :
Move 1 : Long Unite
Closed move
Move 2 : Long Yzy ( -5,3% ) Waiting for a clean validation to reenter

TSTUSDT Forming Falling WedgeTSTUSDT is forming a classic falling wedge pattern, a bullish reversal setup that often signals the end of a downtrend and the beginning of a powerful upward move. The chart structure shows price compression with lower highs and steady support levels, indicating that sellers are losing momentum whil

See all ideas
Summarizing what the indicators are suggesting.
Oscillators
Neutral
SellBuy
Strong sellStrong buy
Strong sellSellNeutralBuyStrong buy
Oscillators
Neutral
SellBuy
Strong sellStrong buy
Strong sellSellNeutralBuyStrong buy
Summary
Neutral
SellBuy
Strong sellStrong buy
Strong sellSellNeutralBuyStrong buy
Summary
Neutral
SellBuy
Strong sellStrong buy
Strong sellSellNeutralBuyStrong buy
Summary
Neutral
SellBuy
Strong sellStrong buy
Strong sellSellNeutralBuyStrong buy
Moving Averages
Neutral
SellBuy
Strong sellStrong buy
Strong sellSellNeutralBuyStrong buy
Moving Averages
Neutral
SellBuy
Strong sellStrong buy
Strong sellSellNeutralBuyStrong buy
Frequently Asked Questions
TST / USDT Spot Trading Pair (TST) reached its highest price on Feb 11, 2025 — it amounted to 0.25130 USDT. Find more insights on the TST price chart.
See the list of crypto gainers and choose what best fits your strategy.
See the list of crypto gainers and choose what best fits your strategy.
TST / USDT Spot Trading Pair (TST) reached the lowest price of 0.00270 USDT on Oct 10, 2025. View more TST / USDT Spot Trading Pair dynamics on the price chart.
See the list of crypto losers to find unexpected opportunities.
See the list of crypto losers to find unexpected opportunities.
The safest choice when buying TST is to go to a well-known crypto exchange. Some of the popular names are Binance, Coinbase, Kraken. But you'll have to find a reliable broker and create an account first. You can trade TST right from TradingView charts — just choose a broker and connect to your account.
You can discuss TST / USDT Spot Trading Pair (TST) with other users in our public chats, Minds or in the comments to Ideas.