Examples of How to Determine When to Trade
Hello, fellow traders!
Follow us to get the latest information quickly.
Have a great day!
-------------------------------------
How can you profit from trading with charts that show the above movements?
To trade, you need a basic trading strategy.
This basic trading strategy varies from person to person, so it's important to create a basic trading strategy that suits you.
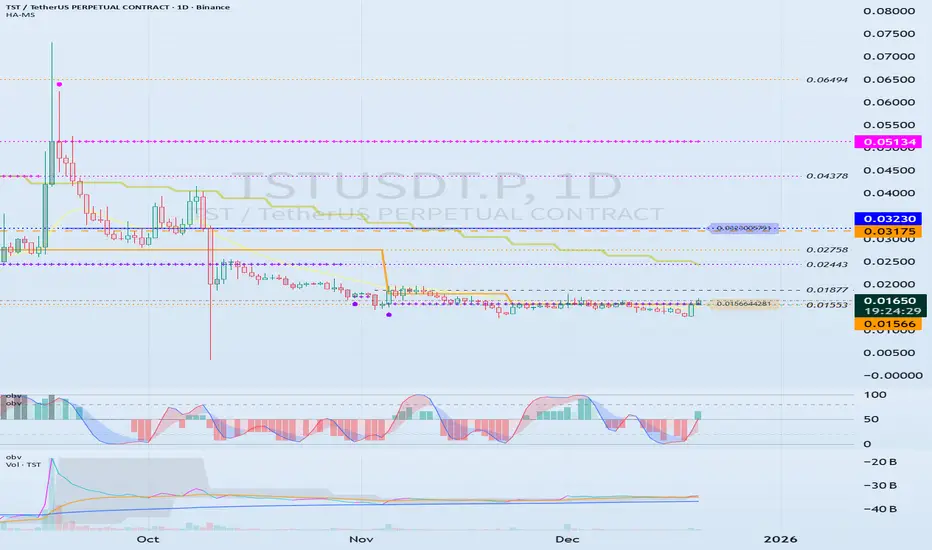
The basic trading strategy I'm suggesting is to buy in the DOM(-60) ~ HA-Low range and sell in the HA-High ~ DOM(60) range.
However, if the HA-High ~ DOM(60) range rises, a step-up trend is likely, while if the DOM(-60) ~ HA-Low range falls, a step-down trend is likely.
Therefore, you should trade using a segmented trading method.
Looking at the chart, you can see that a step-down trend is occurring, and the HA-High indicator has been created for the first time.
Therefore, if the current HA-Low indicator level of 0.01566 is supported and the price rises, the wave will end around 0.03230.
If you zoom in on the chart, you can see that the M-Signal indicator on the 1D chart has risen above the HA-Low indicator and has broken above it.
Therefore, we can see that short-term trading is possible.
The following evidence supports this:
1. The TC indicator has risen above the 0 level.
2. The StochRSI indicator is showing an upward trend.
3. The OBV indicator is showing signs of rising above the High Line.
Therefore, we can initiate a trade around the HA-Low indicator level of 0.01566, depending on whether there is support.
However, since the price is in a stepwise downtrend, if it falls below 0.01566, we should cut our losses or sell in installments to secure funds for future purchases.
A full-scale uptrend is likely to begin when the M-Signal indicator on the 1W chart rises above it.
-
Unlike the TST chart, the CHZ chart has the M-Signal indicator from the 1M chart.
Therefore, to sustain a long-term uptrend, the price must rise above the M-Signal indicator on the 1M chart.
Currently, the price is in a stepwise downtrend, but it has risen above the M-Signal indicator on the 1W chart.
Therefore, if the price remains above the M-Signal indicator on the 1W chart, an uptrend is expected.
As mentioned earlier, the basic trading strategy considers the HA-High ~ DOM (60) range as a sell zone.
Therefore, we should respond based on the presence of support around the 0.04363-0.04631 range.
If the HA-High ~ DOM (60) range supports the price and rises, a stepwise uptrend is likely.
At this point, the key is whether the price can sustain itself by breaking above the M-Siganl indicator on the 1M chart.
-
To continue the uptrend by breaking above a key point or range, the following conditions must be met:
1. The TC indicator must be trending upward. If possible, it should remain above the zero level.
2. The StochRSI indicator must be trending upward. If possible, it should not enter the overbought zone.
3. The OBV indicator must be trending upward. If possible, it should remain above the High Line.
Based on the above conditions, the current price movement appears highly likely to continue upward.
However, if the price breaks above the next important level, the 0.04363-0.04631 range, we must reassess whether the above conditions are met.
------------------------------------------------------------
To trade, we strive to gather as much information as possible.
This information includes issues beyond the chart itself.
However, if you identify issues outside of the chart before the chart analysis is complete, you may end up analyzing the chart subjectively. Therefore, it's best to explore other issues after the chart analysis is complete.
The most important thing when looking at a chart is the flow of funds.
However, it can be difficult for individual investors to understand this flow.
Analyzing trading volume can also be difficult, so to simplify this process, we created the TC indicator, which utilizes the OBV and PVT indicators.
Furthermore, the DOM indicator, which comprehensively evaluates the DMI, OBV, and MONENTUM indicators, also includes trading volume and displays support and resistance points.
Additionally, you can activate the StochRSI 20, 50, and 80 indicators, as well as the OBV High and Low indicators.
You can utilize these indicators to further refine your trading strategy.
However, you should first check the movement and alignment of the M-Signal indicator on the 1M, 1W, and 1D charts.
Next, you should check the location of the DOM(-60) ~ HA-Low or HA-High ~ DOM(-60) range and determine whether there is support near those areas.
Using other people's indicators or chart analysis requires significant time and observation.
Otherwise, you are more likely to misinterpret the data and fail to trade.
To utilize my charts, it's recommended to activate the indicators as follows:
1. Activate only the M-Signal and HA-Low/HA-High indicators on the 1M, 1W, and 1D charts to check and observe the basic chart movements.
You can trade with these indicators alone.
However, if volatility occurs, the high and low points are not clearly defined, which can delay response times.
2. To prevent this, activate the DOM(60) and DOM(-60) indicators. The DOM(60) indicator represents a high, while the DOM(-60) indicator represents a low.
Therefore, you can buy around the DOM(-60) ~ HA-Low range depending on whether there's support, and sell around the HA-High ~ DOM(60) range depending on whether there's support.
3. If you're comfortable interpreting steps 1 and 2, you can use the movements of the auxiliary indicators TC, StochRSI, and OBV.
Steps 1 and 2 can be thought of as indicating support and resistance points. When determining support near these points, refer to the movements of the auxiliary indicators TC, StochRSI, and OBV to help you determine whether there's support.
Becoming proficient at interpreting steps 1 through 3 will greatly aid you in identifying trading opportunities.
-
Thank you for reading to the end.
I wish you successful trading.
--------------------------------------------------
Market insights
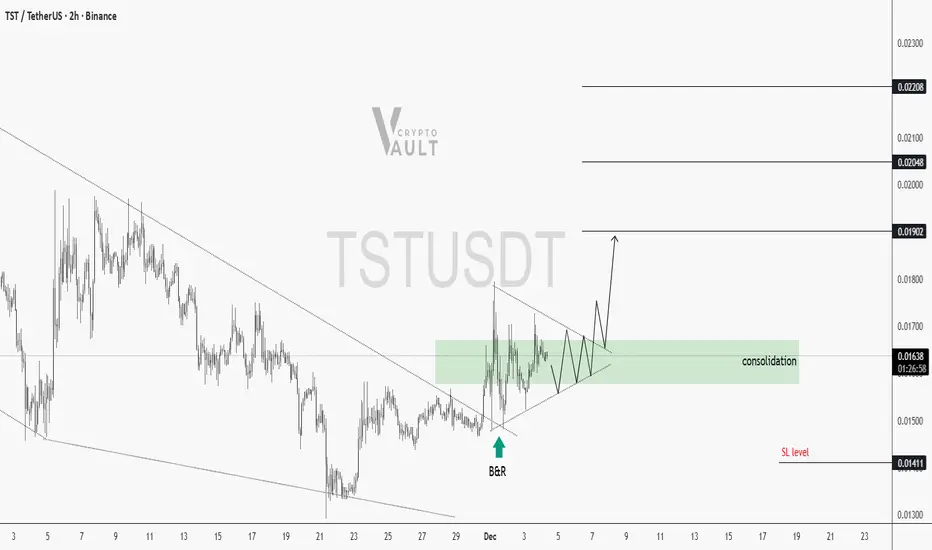
TSTUSDT | This range is loading a movePrice broke out of a descending trendline with a nice Break & Retest (B&R). That strengthen the the shift in structure. Since then, TST is holding inside a consolidation triangle.
As long as price holds this demand block, the market is likely building strength for a continuation move upward.
Upside targets:
$0.01902
$0.02048
$0.02208
Invalidation and SL below $0.01411 after at least a 4H candle close.
Good Luck!
TST REVERSAL LOADINGTST is sitting in strong demand liquidity zone and technicals have also turned Bullish. Use Proper Risk Management

TSTUSDT Forming Falling WedgeTSTUSDT is forming a clear falling wedge pattern, a classic bullish reversal signal that often indicates an upcoming breakout. The price has been consolidating within a narrowing range, suggesting that selling pressure is weakening while buyers are beginning to regain control. With consistent volume confirming accumulation at lower levels, the setup hints at a potential bullish breakout soon. The projected move could lead to an impressive gain of around 290% to 300% once the price breaks above the wedge resistance.
This falling wedge pattern is typically seen at the end of downtrends or corrective phases, and it represents a potential shift in market sentiment from bearish to bullish. Traders closely watching TSTUSDT are noting the strengthening momentum as it nears a breakout zone. The good trading volume adds confidence to this pattern, showing that market participants are positioning early in anticipation of a reversal.
Investors’ growing interest in TSTUSDT reflects rising confidence in the project’s long-term fundamentals and current technical strength. If the breakout confirms with sustained volume, this could mark the start of a fresh bullish leg. Traders might find this a valuable setup for medium-term gains, especially as the wedge pattern completes and buying momentum accelerates.
✅ Show your support by hitting the like button and
✅ Leaving a comment below! (What is your opinion about this Coin?)
Your feedback and engagement keep me inspired to share more insightful market analysis with you!

TSTUSDT UPDATE#TST
UPDATE
TST Technical Setup
Pattern: Falling Wedge Pattern
Current Price: $0.0150
Target Price: $0.0516
Target % Gain: 251.31%
Technical Analysis: TST is breaking out of a falling wedge pattern on the 1D chart, indicating a potential bullish reversal after a prolonged downtrend. Price has compressed tightly near the wedge support and has started pushing above the descending resistance trendline, suggesting seller exhaustion. The projected upside move is based on the wedge height, targeting the highlighted resistance zone. Sustained price action above the breakout level supports further bullish continuation.
Time Frame: 1D
Risk Management Tip: Always use proper risk management.

TSTUSDT 12H#TST is moving inside a falling wedge pattern on the 12H timeframe. Volume has increased, which is a good sign. In case of a breakout above the resistance cluster — consisting of the wedge resistance, the 12H SMA50, and the Ichimoku cloud — the potential targets are:
🎯 $0.01914
🎯 $0.02298
🎯 $0.02608
🎯 $0.02918
🎯 $0.03360
🎯 $0.03923
⚠️ Always remember to use a tight stop-loss and maintain proper risk management.

A look at the longs posted from today's list of potential longsA look at the longs posted from today's list of potential longs using PAR and divergences

TSTUSDTIts a 45 minutes card . 1 day card is also good /
Tst is binance coin . Watch out for ichimouku cloud and resistance level /
It will bring more money and binance has some lag binance takes more high to current price and show you as a loss/but its not real .
Please mention about it in the mail.
Whatch out for levels / always take your profit /
Take care guys .

Move 3 : Long TST TST long.
Catalyseur : BNB and Aster going up + BTC going up
In : 0.03520
Leverage 15
Obj 1 : sell 80%
Obj 2: sell 20%
Ongoing moves :
Move 1 : Long Unite
Closed move
Move 2 : Long Yzy ( -5,3% ) Waiting for a clean validation to reenter

TSTUSDT Forming Falling WedgeTSTUSDT is forming a classic falling wedge pattern, a bullish reversal setup that often signals the end of a downtrend and the beginning of a powerful upward move. The chart structure shows price compression with lower highs and steady support levels, indicating that sellers are losing momentum while buyers are preparing for a potential breakout. With solid trading volume supporting this formation, the probability of a breakout rally looks strong, aligning with the expected gain projection of 240% to 250%+.
The falling wedge pattern is highly regarded in technical analysis because it tends to precede explosive moves when confirmed by a breakout above resistance. In TSTUSDT, the price action suggests that accumulation is taking place, which typically fuels significant upside once buyers take full control. This makes the setup particularly attractive for traders looking to position themselves ahead of a potential major rally.
Investor interest is steadily increasing in this project, which adds to the bullish outlook. With liquidity growing and momentum indicators pointing toward strength, TSTUSDT has the potential to deliver outsized gains if market sentiment remains supportive. The setup offers a strong risk-to-reward ratio, making it a pair worth watching closely in the coming sessions.
✅ Show your support by hitting the like button and
✅ Leaving a comment below! (What is You opinion about this Coin)
Your feedback and engagement keep me inspired to share more insightful market analysis with you!

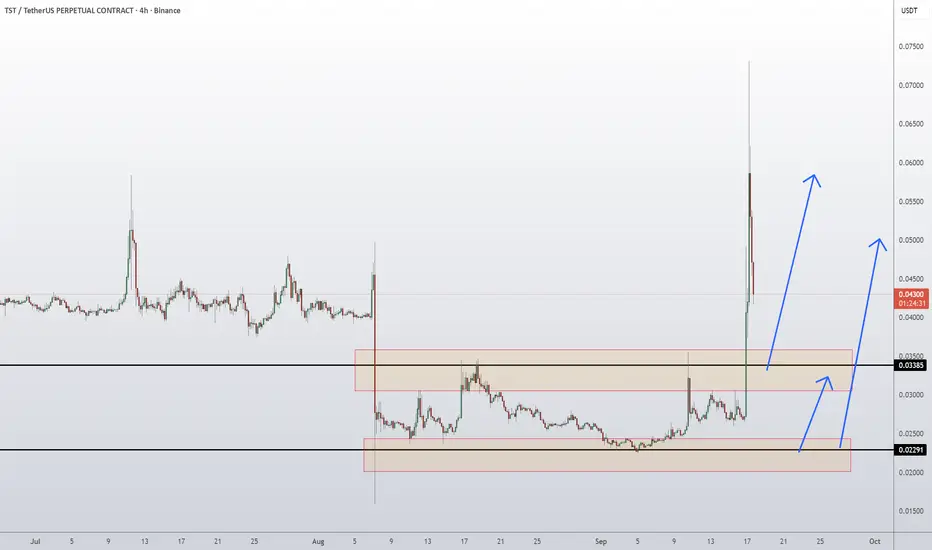
Test Coin TST Token Price Prediction and Technical AnalysisTST/USDT has broken out with a sharp rally from the 0.0229 demand base, clearing the 0.0338 resistance zone and extending toward 0.0521 before facing rejection. Price is now pulling back, and as long as it holds above 0.0338, the bullish structure remains intact. A healthy retest of this support could provide momentum for another leg higher, while failure to defend it risks a return to the 0.0229 demand zone before any recovery attempt.
📈 Key Levels:
Buy trigger: Retest/hold above 0.0338 support
Buy zone: 0.023 – 0.034 region
Target 1: 0.0521 resistance (recent high)
Target 2: Extension toward 0.06 if momentum continues
Invalidation: Daily close below 0.0229 (would negate bullish setup)
👉 Follow me for More Real Time Opportunities.
Share your Thoughts if you have any?
TSTUSDT Forming Falling WedgeTSTUSDT is forming a classic falling wedge pattern, a bullish reversal setup that often signals the end of a downtrend and the beginning of a powerful upward move. The chart structure shows price compression with lower highs and steady support levels, indicating that sellers are losing momentum while buyers are preparing for a potential breakout. With solid trading volume supporting this formation, the probability of a breakout rally looks strong, aligning with the expected gain projection of 240% to 250%+.
The falling wedge pattern is highly regarded in technical analysis because it tends to precede explosive moves when confirmed by a breakout above resistance. In TSTUSDT, the price action suggests that accumulation is taking place, which typically fuels significant upside once buyers take full control. This makes the setup particularly attractive for traders looking to position themselves ahead of a potential major rally.
Investor interest is steadily increasing in this project, which adds to the bullish outlook. With liquidity growing and momentum indicators pointing toward strength, TSTUSDT has the potential to deliver outsized gains if market sentiment remains supportive. The setup offers a strong risk-to-reward ratio, making it a pair worth watching closely in the coming sessions.
✅ Show your support by hitting the like button and
✅ Leaving a comment below! (What is You opinion about this Coin)
Your feedback and engagement keep me inspired to share more insightful market analysis with you!

TST : Waiting for the defeat of suffering...Hello friends🙌
✅ considering the large and frequent declines of this currency, we do not take unreasonable risks and have identified the trading range that has formed and are waiting for the range to break.
✅If there is a valid resistance break, you can buy and move with it to the targets specified by Fibonacci.
✅In the event of a continuation of the decline and a valid break of the range from below, you can enter a sell trade and move with it to the targets specified by Fibonacci.
✅Be sure to observe capital management.✅
🔥Follow us for more signals🔥
*Trade safely with us*

TSTUSDT Forming Falling WedgeTSTUSDT is looking increasingly attractive for traders who specialize in breakout patterns, as the pair is currently trading within a classic falling wedge pattern. This bullish reversal setup often signals the end of a downtrend and the start of a strong upward move when confirmed by a breakout above the wedge’s resistance line. The current volume is supportive, showing that buyers are gradually stepping in to accumulate positions, which aligns with the growing interest investors are showing in this project.
From a technical perspective, the falling wedge pattern is one of the most reliable bullish chart patterns in crypto trading. It suggests that downward momentum is weakening and that an explosive move to the upside could be on the horizon. TSTUSDT traders should monitor this pair closely for a decisive breakout candle on higher-than-average volume, as that could be the catalyst for the expected 90% to 100%+ gain. This type of setup can be ideal for both swing traders and position traders looking for a high-probability opportunity.
In addition to the pattern itself, TST’s project fundamentals are attracting positive sentiment in the broader crypto community. With an active development team and a roadmap that continues to deliver updates, confidence in TST’s long-term growth is increasing. As investor interest continues to build, this could provide the momentum needed to sustain the breakout and reach the projected targets.
✅ Show your support by hitting the like button and
✅ Leaving a comment below! (What is You opinion about this Coin)
Your feedback and engagement keep me inspired to share more insightful market analysis with y

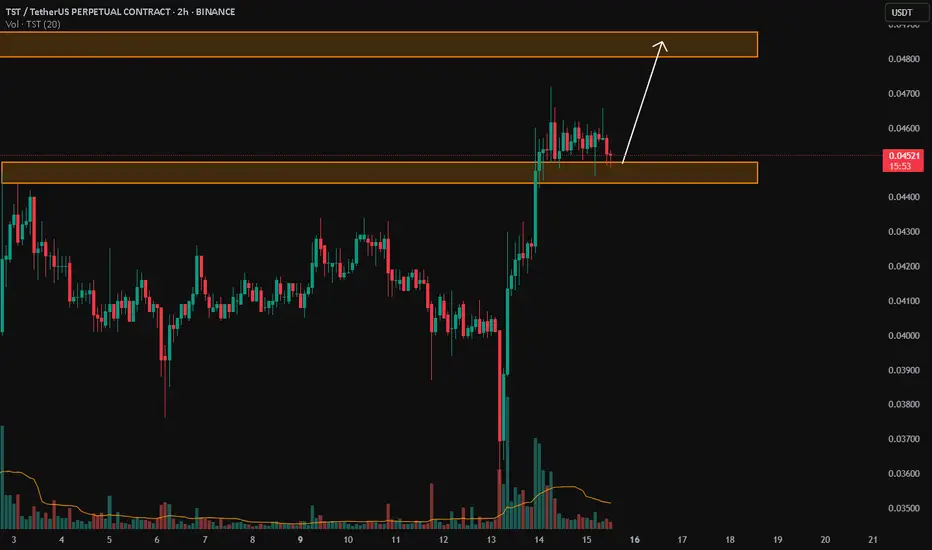
TST/USDTKey Level Zone: 0.04440 0.04500
LMT v2.0 detected.
The setup looks promising—price previously trended upward with rising volume and momentum, then retested this zone cleanly. This presents an excellent reward-to-risk opportunity if momentum continues to align.
Introducing LMT (Levels & Momentum Trading)
- Over the past 3 years, I’ve refined my approach to focus more sharply on the single most important element in any trade: the KEY LEVEL.
- While HMT (High Momentum Trading) served me well—combining trend, momentum, volume, and structure across multiple timeframes—I realized that consistently identifying and respecting these critical price zones is what truly separates good trades from great ones.
- That insight led to the evolution of HMT into LMT – Levels & Momentum Trading.
Why the Change? (From HMT to LMT)
Switching from High Momentum Trading (HMT) to Levels & Momentum Trading (LMT) improves precision, risk control, and confidence by:
- Clearer Entries & Stops: Defined key levels make it easier to plan entries, stop-losses, and position sizing—no more guesswork.
- Better Signal Quality: Momentum is now always checked against a support or resistance zone—if it aligns, it's a stronger setup.
- Improved Reward-to-Risk: All trades are anchored to key levels, making it easier to calculate and manage risk effectively.
- Stronger Confidence: With clear invalidation points beyond key levels, it's easier to trust the plan and stay disciplined—even in tough markets.
Whenever I share a signal, it’s because:
- A high‐probability key level has been identified on a higher timeframe.
- Lower‐timeframe momentum, market structure and volume suggest continuation or reversal is imminent.
- The reward‐to‐risk (based on that key level) meets my criteria for a disciplined entry.
***Please note that conducting a comprehensive analysis on a single timeframe chart can be quite challenging and sometimes confusing. I appreciate your understanding of the effort involved.
Important Note: The Role of Key Levels
- Holding a key level zone: If price respects the key level zone, momentum often carries the trend in the expected direction. That’s when we look to enter, with stop-loss placed just beyond the zone with some buffer.
- Breaking a key level zone: A definitive break signals a potential stop‐out for trend traders. For reversal traders, it’s a cue to consider switching direction—price often retests broken zones as new support or resistance.
My Trading Rules (Unchanged)
Risk Management
- Maximum risk per trade: 2.5%
- Leverage: 5x
Exit Strategy / Profit Taking
- Sell at least 70% on the 3rd wave up (LTF Wave 5).
- Typically sell 50% during a high‐volume spike.
- Move stop‐loss to breakeven once the trade achieves a 1.5:1 R:R.
- Exit at breakeven if momentum fades or divergence appears.
The market is highly dynamic and constantly changing. LMT signals and target profit (TP) levels are based on the current price and movement, but market conditions can shift instantly, so it is crucial to remain adaptable and follow the market's movement.
If you find this signal/analysis meaningful, kindly like and share it.
Thank you for your support~
Sharing this with love!
From HMT to LMT: A Brief Version History
HM Signal :
Date: 17/08/2023
- Early concept identifying high momentum pullbacks within strong uptrends
- Triggered after a prior wave up with rising volume and momentum
- Focused on healthy retracements into support for optimal reward-to-risk setups
HMT v1.0:
Date: 18/10/2024
- Initial release of the High Momentum Trading framework
- Combined multi-timeframe trend, volume, and momentum analysis.
- Focused on identifying strong trending moves high momentum
HMT v2.0:
Date: 17/12/2024
- Major update to the Momentum indicator
- Reduced false signals from inaccurate momentum detection
- New screener with improved accuracy and fewer signals
HMT v3.0:
Date: 23/12/2024
- Added liquidity factor to enhance trend continuation
- Improved potential for momentum-based plays
- Increased winning probability by reducing entries during peaks
HMT v3.1:
Date: 31/12/2024
- Enhanced entry confirmation for improved reward-to-risk ratios
HMT v4.0:
Date: 05/01/2025
- Incorporated buying and selling pressure in lower timeframes to enhance the probability of trending moves while optimizing entry timing and scaling
HMT v4.1:
Date: 06/01/2025
- Enhanced take-profit (TP) target by incorporating market structure analysis
HMT v5 :
Date: 23/01/2025
- Refined wave analysis for trending conditions
- Incorporated lower timeframe (LTF) momentum to strengthen trend reliability
- Re-aligned and re-balanced entry conditions for improved accuracy
HMT v6 :
Date : 15/02/2025
- Integrated strong accumulation activity into in-depth wave analysis
HMT v7 :
Date : 20/03/2025
- Refined wave analysis along with accumulation and market sentiment
HMT v8 :
Date : 16/04/2025
- Fully restructured strategy logic
HMT v8.1 :
Date : 18/04/2025
- Refined Take Profit (TP) logic to be more conservative for improved win consistency
LMT v1.0 :
Date : 06/06/2025
- Rebranded to emphasize key levels + momentum as the core framework
LMT v2.0
Date: 11/06/2025
- Fully restructured lower timeframe (LTF) momentum logic
- Enhanced entry timing for better precision and alignment with key levels
TSTUSDT preparing for a longThe idea has been shared. Looking for some bullish momentum at my level.
The center rectangle will be my first target.
DYOR
TST Bulls in Control! What’s Your Target?LSE:TST breakout in play? 🚀
TST fundamentally and socially is decent, but technically it looks great it just broke out of a symmetrical triangle, flipping resistance into support with strong bullish momentum. Price is holding above the breakout zone a clear sign of strength.
If this momentum continues, the next leg up could be explosive.
Key upside targets:
• $0.095
• $0.125
• $0.150
Could this be the start of TST’s next bullish run?
Drop your thoughts below. 👇
#TST #Altseason2025

TST USDT 30% potential TST is showing strong momentum with a 30% upside potential against USDT, driven by bullish market sentiment and increased trading volume. Key resistance levels are within reach, making it a promising short-term play.

TST Sell/Short Setup (4H)TST has a bearish structure on the higher timeframes.
It is currently in a pullback phase within the substructure.
We are looking for sell/short positions around the flip zone, which acts as a Supply area.
There is a liquidity pool at the bottom of the chart, which is likely the target for a sweep.
A daily candle closing above the invalidation level will invalidate this outlook.
Do not enter the position without capital management and stop setting
Comment if you have any questions
thank you

TST SIGNAL SPOT DAILY TST SIGNAL SPOT DAILY
Entry: $0.0694 or $0.0656
Target: $0.08 - $0.09
Hold Time: Follow the D1 (Daily) Cycle

TEST/USDTThe price action of TST looks prime for a major breakout. It been consolidating within this descending triangle and now looking for a breakout

TST COIN NEXT POSSIBLE MOVES AND TRADE IDEAS !!LSE:TST Coin!!
• Technically & Fundamentally its look bullish🫡
• if market get little bit stable then pottential bounce back expected❤️
• if you want then you can build small amount spot trade on it.. Stoploss will be only 0.065$ ( if daily candle close below this level)
• For add it in swing trade.. Its also a good buying price🫡
Warning : That's just my trade idea DYOR Before taking any action🚨

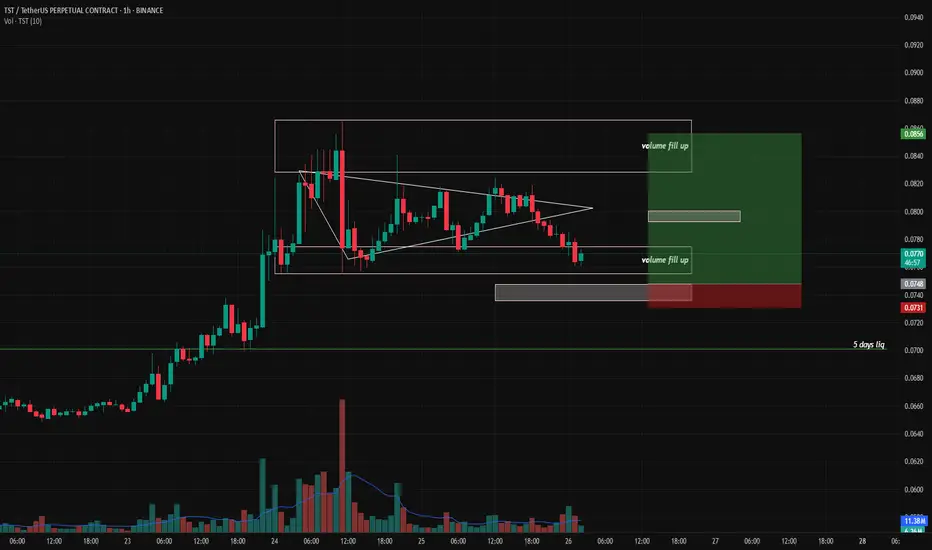
$TST ANALYSIS!LSE:TST is testing the red resistance zone 🟥.
🟢 Option 1: If breakout occurs, the first target is the green line level 🟩.
🔵 Option 2: If it fails and retraces to the green zone, there is a potential entry 📈 for a bounce back up.
