Brent Oil Analysis – Inverted Head and Shoulders PatternBrent Oil Analysis – Inverted Head and Shoulders Pattern
The chart shows a Head and Shoulders pattern, which is often a sign that the price may change direction.
The current price is around 67.35, and if the pattern continues, oil could rise towards the first target at 68.90, and possibly reach t
About CFDs on Crude Oil (Brent)
The Brent Сrude oil was originally produced from the Brent oilfield in the North Sea. About 2/3rds of all crude oil contracts around the globe include Brent Сrude oil, making it the most popular marker. Its relatively low density and sulphur content are the reasons why it’s described as light and sweet. One of the advantages is transportation since this type of oil is waterborne. The Brent Crude oil marker is also known as Brent Blend, London Brent and Brent petroleum and has a UKOIL ticker symbol.

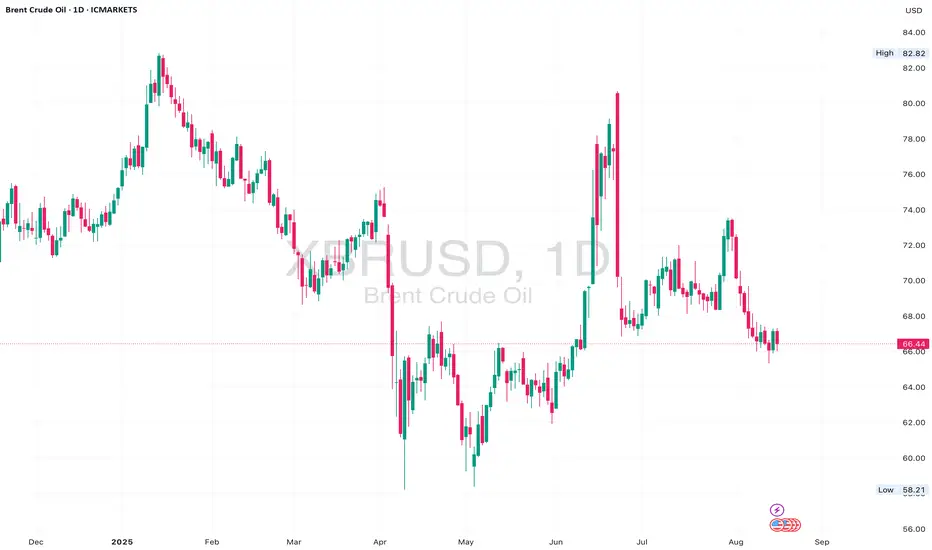
XBR/USD Chart Analysis: Brent Crude Nears Its Lowest LevelXBR/USD Chart Analysis: Brent Crude Nears Its Lowest Level Since Early Summer
According to the XBR/USD chart, this morning (19 August) Brent crude oil price is showing bearish momentum, moving towards its lowest level since early summer (set last week). The key bearish drivers in the market includ


Oil; War or supply and demandOil is preparing for a strong upward move and is in the buying range marked with blue lines and will move at least to the ceiling range if confirmed.
Will the war in the Middle East or US economic policies or supply and demand of OPEC and other producers cause this move?
We have to wait and see
S

UKOIL H4 | Bullish reversal off pullback supportBased on the H4 chart analysis, we could see the price falling towards the buy entry, which is a pullback support and could potentially bounce from this level to the upside.
Buy entry is at 66.57, which is a pullback support.
Stop loss is at 65.58, which is a multi-swing low support.
Take profit

Brent Crude consolidation range The Brent Crude Oil is currently trading with a bearish bias, aligned with the broader downward trend. Recent price action shows a retest of the resistance, suggesting a further selling pressure within the downtrend.
Key resistance is located at 6790, a prior consolidation zone. This level will be


UKOIL H4 | Bullish riseUKOIL is falling towards the buy entry which is a pullback support and could bounce from this level to the upside.
Buy entry is at 66.99
Stop loss is at 65.64
Take profit is at 69.79
High Risk Investment Warning
Trading Forex/CFDs on margin carries a high level of risk and may not be suitable fo

Brent Crude Oil Wave Analysis – 21 August 2025
- Brent Crude Oil reversed from support area
- Likely to rise to resistance level 68.00
Brent Crude Oil recently reversed from the support area between the support level 66.00 (which has been reversing the price from June) and the lower daily Bollinger Band.
The support level 66.00 was further st

Brent Crude Squeeze – Daily Symmetrical Triangle Nears BreakoutBrent Crude has been consolidating within a symmetrical triangle on the daily chart since mid-May, following a strong bullish recovery from $58 lows. Price is now approaching the apex of the structure, suggesting a breakout is imminent.
We’re still holding above the higher low trendline support, bu
See all ideas
Summarizing what the indicators are suggesting.
Oscillators
Neutral
SellBuy
Strong sellStrong buy
Strong sellSellNeutralBuyStrong buy
Oscillators
Neutral
SellBuy
Strong sellStrong buy
Strong sellSellNeutralBuyStrong buy
Summary
Neutral
SellBuy
Strong sellStrong buy
Strong sellSellNeutralBuyStrong buy
Summary
Neutral
SellBuy
Strong sellStrong buy
Strong sellSellNeutralBuyStrong buy
Summary
Neutral
SellBuy
Strong sellStrong buy
Strong sellSellNeutralBuyStrong buy
Moving Averages
Neutral
SellBuy
Strong sellStrong buy
Strong sellSellNeutralBuyStrong buy
Moving Averages
Neutral
SellBuy
Strong sellStrong buy
Strong sellSellNeutralBuyStrong buy
Displays a symbol's price movements over previous years to identify recurring trends.