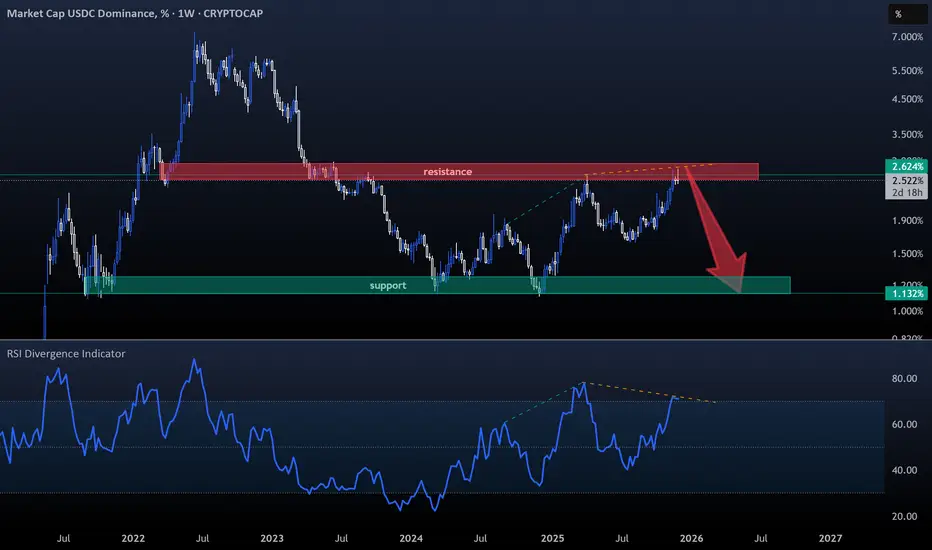
USDC DOM- I haven’t covered Circle’s stablecoin recently. Tether's USDT remains the clear leader at 6% Dom, but with USDC rising back to 2.5% Dom, it’s definitely worth watching again.
- The chart is simple, focus on the Weekly RSI and you’ll see a clear divergence developing on the weekly timeframe.
- So
Key data points
Previous close
—
Open
—
Day's range
—
About Market Cap USDC Dominance, %
Coin
"Falling Knife" Stable Coins Dominance Analysis (1W)Hello everyone.
The entire crypto market is about to face a crucial decline.
There are many technical ways to show it.
I'm here today to show you one of them.
One of the best ways of examining the crypto market is checking the stablecoin dominance.
The most famous way to do it is simply looking at

More Clues Towards Bearish MovesCRYPTOCAP:USDC.D CRYPTOCAP:TOTAL2 CRYPTOCAP:OTHERS
USDC.D - Similar to USDT.D: Inverse Correlation to TOTAL. Mostly Inverted, there are sections where they take the same train. As USDC.D rises, capital rotates from assets to the stable coin, signaling "risk-off" behavior.
Candles are formi


USDC.D + USDT.D updateTracing well!
Looks like a fib extension intercept on the lower rail at the very end of July 25/extremely early August 25 (= Estimated Altcoin top)
Will match what BTC.D is looking to do as well.
WE ARE ON THE PRECIPICE
Insanity will follow!
Not financial advice

Wen Crypto Rally?If we want #CryptoRally , then first of all #usdc dominance must break down daily EMA200 i highlighted in the chart. If this support plays out well, then mid term W bounce of #usdcd must continue. And also in BTCXAU chart, 33 must be broken to be bullish for BTC.

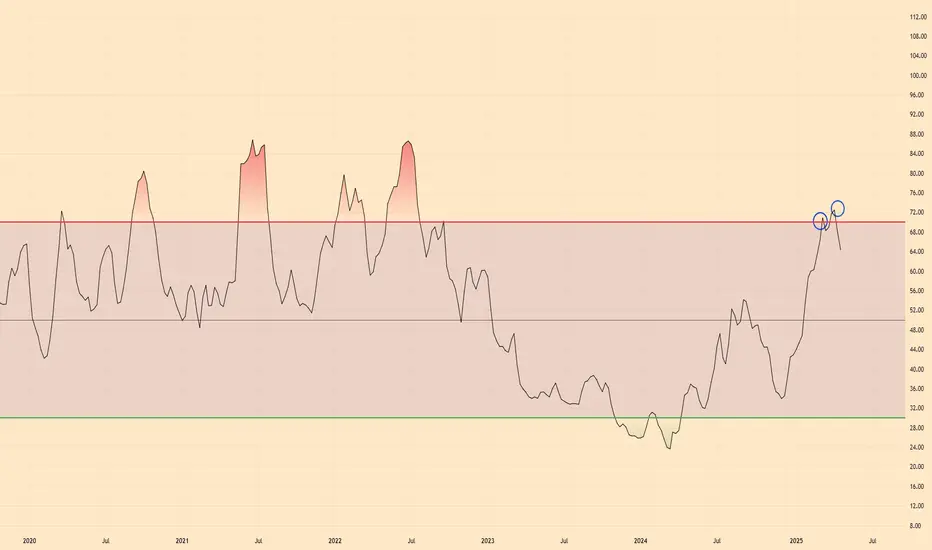
$USDC | Altseason Incoming.....FinallyCRYPTOCAP:USDC Dominance looks to be Double Topped on the RSI side and per historic movements, this looks promising for the market.
I say, BRING ON THE ALTCOINS.

Ding Dong altcoin bullrunC'MON ALREADY lol
Waiting for cash positions in crypto to reduce
Not financial advice

USDT USDC DOWNTIME? Come on, potential for bearish divergence on weekly with end of may ish target
GLA
Not financial advice

See all ideas
Summarizing what the indicators are suggesting.
Oscillators
Neutral
SellBuy
Strong sellStrong buy
Strong sellSellNeutralBuyStrong buy
Oscillators
Neutral
SellBuy
Strong sellStrong buy
Strong sellSellNeutralBuyStrong buy
Summary
Neutral
SellBuy
Strong sellStrong buy
Strong sellSellNeutralBuyStrong buy
Summary
Neutral
SellBuy
Strong sellStrong buy
Strong sellSellNeutralBuyStrong buy
Summary
Neutral
SellBuy
Strong sellStrong buy
Strong sellSellNeutralBuyStrong buy
Moving Averages
Neutral
SellBuy
Strong sellStrong buy
Strong sellSellNeutralBuyStrong buy
Moving Averages
Neutral
SellBuy
Strong sellStrong buy
Strong sellSellNeutralBuyStrong buy
Displays a symbol's price movements over previous years to identify recurring trends.