USDCAD: a long positionHello guys.
Divergence:
A bullish RSI divergence is noted, price made lower lows while RSI formed higher lows, signaling a potential bullish reversal.
Price Action:
Price has bounced strongly from around the 1.3570–1.3580 zone and is now approaching a descending trendline resistance.
Trade Setup
About U.S. Dollar / Canadian Dollar
The US Dollar vs. the Canadian Dollar is a very popular currency pair due to the extremely large amount of cross border trading that occurs between the U.S. and Canada. The CAD is considered to be a commodity currency because of the large amount of natural resources, especially oil, that are mined and exported to southern neighbors. The USDCAD is one of the most traded currency pairs in the world.
Related currencies

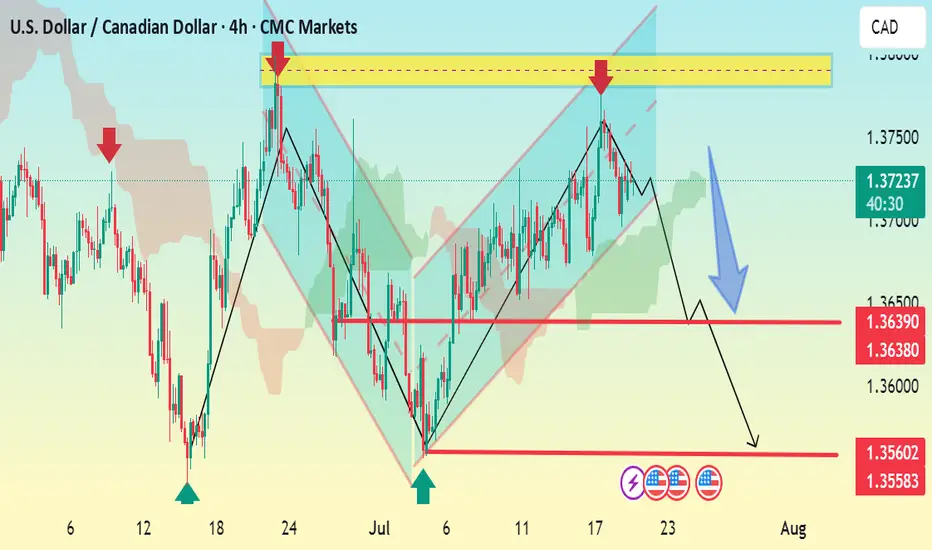
Price channel break. Will the downtrend take place?✏️USDCAD broke the price channel and started forming a bearish wave. The resistance zone of 1.370 played an important role in starting the bearish wave. 1.365 is the immediate support zone that the pair faces. If it wants to extend the decline, it needs to close the h1 candle below this price zone.

USDCAD 4H Bearish SetupThe USDCAD chart shows a clear bearish breakdown from the ascending channel. Price has broken below support near 1.3720, confirming a shift in structure.
Key Analysis:
Bearish Momentum: Break below the channel and current market structure signals downside pressure.
Immediate Resistance: 1.3725–1.
USDCAD BUYUSD/CAD returns below 1.3600, with YTD lows, at 1.3540 coming into view
The US Dollar extends its decline for the fourth consecutive day, with the Canadian Dollar supported by a brighter market mood, as the trade deal between the US and Japan provided some certainty about the outlook of global trade
USDCAD Break the trendline resistance USDCAD has brokend the trendline resistance is likely to to go next resistance as shown in the chart. The set up is valid till the uptrend trendline is respected by the price.

BUY USDCADUSDCAD is currently i a good and clearpoint of interest , i expect the market to push ever since it has already changed its bearish character to bullish , with a supporting trendline liquidity whivch has been swapped out with a bearish push
use proper risk management
and goodluck.. manage ur trade

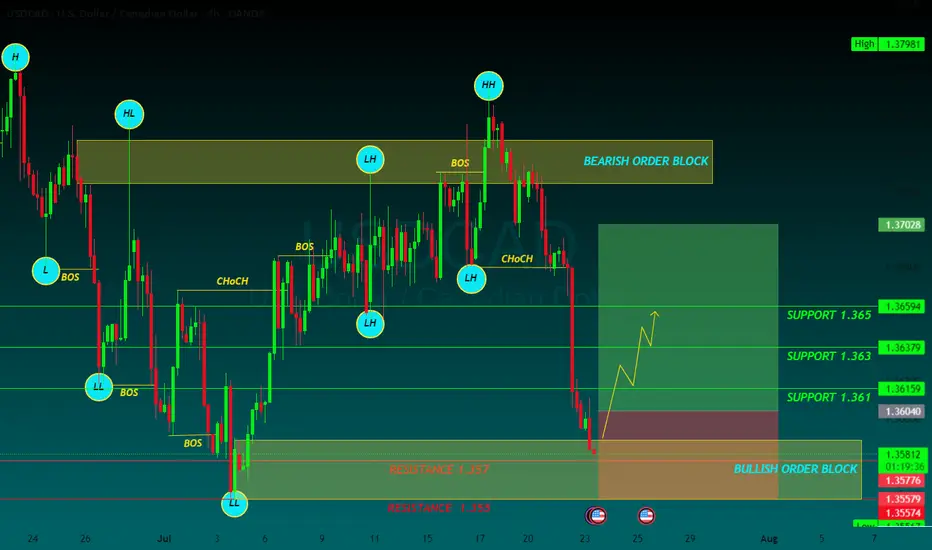
Uptrend is coming. Opportunity for buyers✏️ OANDA:USDCAD is trading close to the upper boundary of the triangle pattern. There is a high possibility that the current bullish momentum will break the upper boundary and form an uptrend for the USDCAD pair. The important price zone for the sellers at the moment is 1.075. If the buyers are s

USDCAD Buyers In Panic! SELL!
My dear subscribers,
This is my opinion on the USDCAD next move:
The instrument tests an important psychological level 1.3704
Bias - Bearish
Technical Indicators: Supper Trend gives a precise Bearish signal, while Pivot Point HL predicts price changes and potential reversals in the market.
Tar
USD/CAD Unless oil rockets, then the pair has room to rise.From June till now, we’ve been in a range-bound market, with multiple failed attempts to break lower.
But now we’re seeing higher lows forming, and price is bouncing off my fvp zone @ 1.36600 . So if the Fed stays patient and oil stays weak or sideways, USD/CAD bulls have the upper hand. I am expect

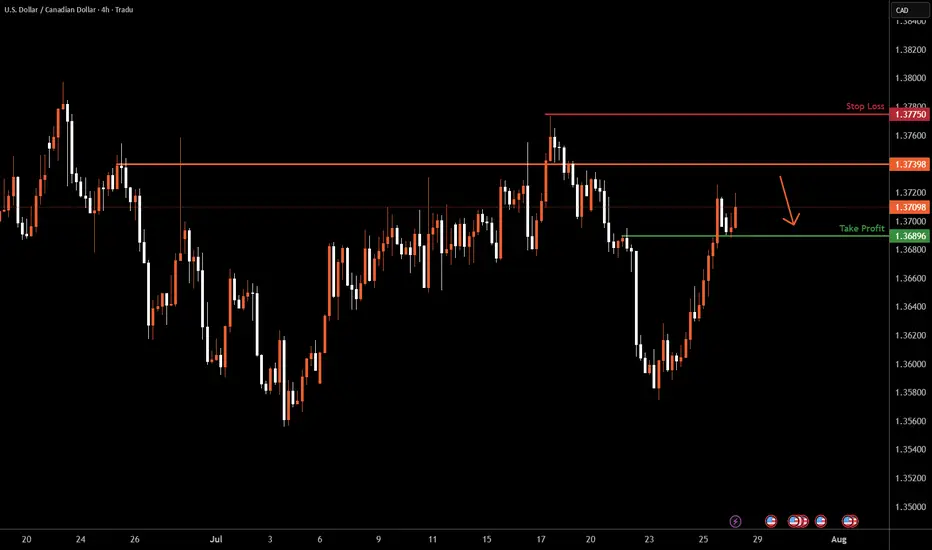
USDCAD H4 I Bearish Reversal OffBased on the H4 chart analysis, we can see that the price is rising toward our sell entry at 1.3739, which is a pullback resistance.
Our take profit will be at 1.3689, an overlap support level.
The stop loss will be placed at 1.3775, the swing-high resistance level.
High Risk Investment Warnin
See all ideas
Summarizing what the indicators are suggesting.
Oscillators
Neutral
SellBuy
Strong sellStrong buy
Strong sellSellNeutralBuyStrong buy
Oscillators
Neutral
SellBuy
Strong sellStrong buy
Strong sellSellNeutralBuyStrong buy
Summary
Neutral
SellBuy
Strong sellStrong buy
Strong sellSellNeutralBuyStrong buy
Summary
Neutral
SellBuy
Strong sellStrong buy
Strong sellSellNeutralBuyStrong buy
Summary
Neutral
SellBuy
Strong sellStrong buy
Strong sellSellNeutralBuyStrong buy
Moving Averages
Neutral
SellBuy
Strong sellStrong buy
Strong sellSellNeutralBuyStrong buy
Moving Averages
Neutral
SellBuy
Strong sellStrong buy
Strong sellSellNeutralBuyStrong buy
Displays a symbol's price movements over previous years to identify recurring trends.
Frequently Asked Questions
The current rate of USDCAD is 1.37764 CAD — it has increased by 0.13% in the past 24 hours. See more of USDCAD rate dynamics on the detailed chart.
The value of the USDCAD pair is quoted as 1 USD per x CAD. For example, if the pair is trading at 1.50, it means it takes 1.5 CAD to buy 1 USD.
The term volatility describes the risk related to the changes in an asset's value. USDCAD has the volatility rating of 0.39%. Track all currencies' changes with our live Forex Heatmap and prepare for markets volatility.
The USDCAD showed a 0.03% rise over the past week, the month change is a 0.54% rise, and over the last year it has decreased by −0.37%. Track live rate changes on the USDCAD chart.
Learn how you can make money on rate changes in numerous trading ideas created by our community.
Learn how you can make money on rate changes in numerous trading ideas created by our community.
USDCAD is a major currency pair, i.e. a popular currency paired with USD.
Currencies are usually traded through forex brokers — choose the one that suits your needs and go ahead. You can trade USDCAD right from TradingView charts — just log in to you broker account. Check out the list of our integrated brokers and find the best one for your needs and strategy.
When deciding to buy or sell currency one should keep in mind many factors including current geopolitical situation, interest rates, and other. But before plunging into a deep research, you can start with USDCAD technical analysis. The technical rating for the pair is buy today, but don't forget that markets can be very unstable, so don't stop here. According to our 1 week rating the USDCAD shows the sell signal, and 1 month rating is buy. See more of USDCAD technicals for a more comprehensive analysis.