USD/CAD - Ascending Triangle (18.08.2025)The USD/CAD Pair on the M30 timeframe presents a Potential Selling Opportunity due to a recent Formation of a Ascending Triangle Pattern. This suggests a shift in momentum towards the downside in the coming hours.
Possible Short Trade:
Entry: Consider Entering A Short Position around Trendline
About U.S. Dollar / Canadian Dollar
The US Dollar vs. the Canadian Dollar is a very popular currency pair due to the extremely large amount of cross border trading that occurs between the U.S. and Canada. The CAD is considered to be a commodity currency because of the large amount of natural resources, especially oil, that are mined and exported to southern neighbors. The USDCAD is one of the most traded currency pairs in the world.
Related currencies

USD/CAD: The Perfect Storm for a Bullish BreakoutUSD/CAD is consolidating above 1.3850 after a strong bullish impulse. The technical structure shows:
A breakout from the summer bullish channel projecting towards 1.3950–1.4050, a key weekly resistance zone.
RSI remains neutral but strengthening, with no signs of immediate overextension.
Institution

USDCAD - price increase after correction. Bullish trendA reversal pattern is forming, indicating the emergence of limit resistance from bears. The pattern structure has been broken, and the price has entered the realization phase. As part of a downward rally, USDCAD may test 0.5 Fibonacci and return to the bullish trend.
Scenario: The current aggress

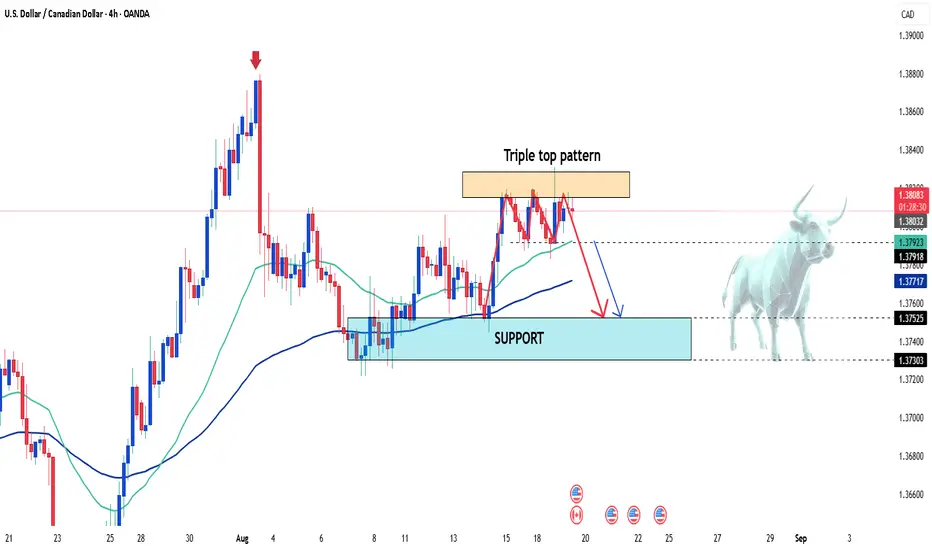
USDCAD Analysis: Triple Top Pattern and Bearish OutlookHello everyone, what do you think about OANDA:USDCAD ?
The USD/CAD pair has formed a Triple Top Pattern, indicating a potential reversal after struggling to break through recent highs. The price has failed to maintain the bullish momentum and has been rejected at key resistance levels. With the m
USDCAD Heading Towards Important Resistance D1✏️The old USDCAD analysis strategy was correct when the uptrend returned to the pair. 1.399 is the target of BUY signals when this zone accumulates a lot of selling momentum. The Breakout zone of 1.375 is considered a strong support zone forming a wide price range of the pair. The trading strategy i

USD/CAD: Inverse Head & Shoulders Playing OutHello guys.
The chart is showing a clear inverse head & shoulders pattern, which often signals a potential bullish reversal.
Price is now pushing above the neckline, suggesting momentum is shifting to the upside. As long as buyers hold this breakout, there’s room for continuation toward the 1.385

USDCAD: Pullback Continues 🇺🇸🇨🇦
There is a high chance that USDCAD will recover
after a formation of a huge FVG on Friday.
As a confirmation, I see a bullish Change of Character
on an hourly time frame.
Goal - 1.385
❤️Please, support my work with like, thank you!❤️
I am part of Trade Nation's Influencer program and receiv

USD/ CAD Analysis is Ready This chart shows a bearish outlook for USD/CAD (1H timeframe). Price reached the channel’s upper boundary (resistance) at 1.3887 and is expected to reverse downward. The projected targets are 1.3830 and 1.3782, forming the highlighted target zone.

25.08.25 Morning ForecastPairs on Watch -
FX:USDCAD
FX:EURAUD
FX:AUDJPY
A short overview of the instruments I am looking at for today, multi-timeframe analysis down to what I will be looking at for an entry. Enjoy!

USDCAD ~ Cheapy Choapa? IDKThe triple top resistance is found on the USDCAD weekly chart!
What we may expect with it is a high-quality downtrend.
But for the reason "This chart is so beautiful," here I have to say,
We need to be careful about this position UNTIL confirmation on sell.
Nika.

See all ideas
Displays a symbol's price movements over previous years to identify recurring trends.
Frequently Asked Questions
The value of the USDCAD pair is quoted as 1 USD per x CAD. For example, if the pair is trading at 1.50, it means it takes 1.5 CAD to buy 1 USD.
USDCAD is a major currency pair, i.e. a popular currency paired with USD.
Currencies are usually traded through forex brokers — choose the one that suits your needs and go ahead. You can trade USDCAD right from TradingView charts — just log in to you broker account. Check out the list of our integrated brokers and find the best one for your needs and strategy.