US CRUDE OIL (WTI): Classic Trend-Following Setup I spotted a very classic bullish model on 📈USOIL.
Following a strong bullish wave, the market started to correct within a bullish flag pattern.
The resistance breakout of this pattern consistently provides a reliable confirmation to consider a buy.
I anticipate a rise to 62.50 at this time.
About CFDs on Crude Oil (WTI)
Crude Oil is a naturally occurring liquid fossil fuel resulting from plants and animals buried underground and exposed to extreme heat and pressure. Crude oil is one of the most demanded commodities and prices have significantly increased in recent times. Two major benchmarks for pricing crude oil are the United States' WTI (West Texas Intermediate) and United Kingdom's Brent. The differences between WTI and Brent include not only price but oil type as well, with WTI producing crude oil with a different density and sulfur content. The demand for crude oil is dependent on global economic conditions as well as market speculation. Crude oil prices are commonly measured in USD. Although there have been discussions of replacing the USD with another trade currency for crude oil, no definitive actions have been taken.

CRUDE OIL (WTI): Strong Selling Imbalance
Look at a large selling imbalance candle that was formed
on an hourly time frame after a test of falling trend line on a daily.
I think that there is a high chance that WTI Crude Oil will
continue falling now.
Goal - 59.6
❤️Please, support my work with like, thank you!❤️
I am part of Trad

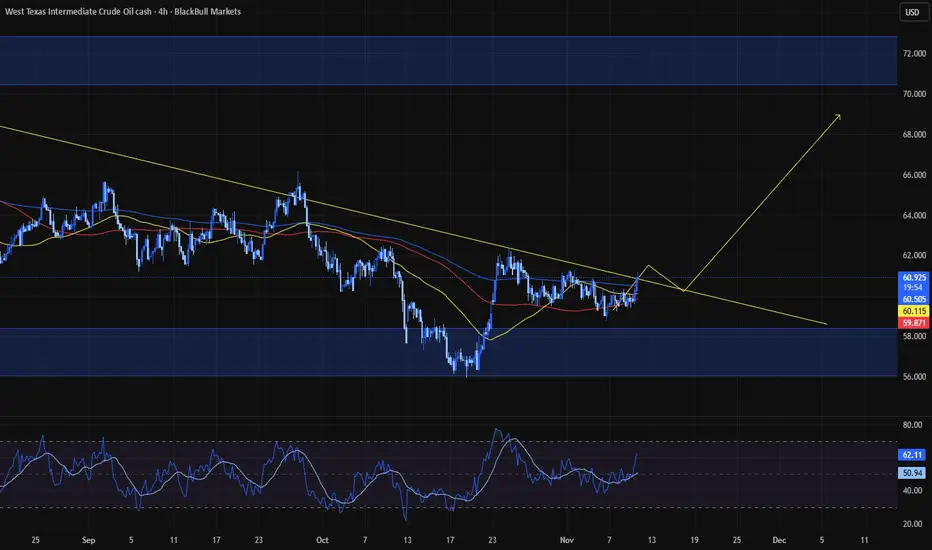
Hellena | Oil (4H): LONG to resistance area 64.8.Colleagues, in fact, I have not changed the wave markup, but I have a slightly different view on the near-term price movement plan.
In the last forecast I emphasized that the target is the area of 58.9, but now it looks more likely that the completion of wave “C” in a complex correction (resistance

How to Trade Crude Oil with Smart Money Concepts SMC Explained
Smart Money Concepts is one of the most reliable techniques for trading WTI Crude Oil.
In this article, I will teach you a profitable SMC strategy for analysing and trading USOIL futures and CFD.
This simple strategy is based on an important event every SMC trader should know - a break of
USOIL Will Grow! Long!
Please, check our technical outlook for USOIL.
Time Frame: 1D
Current Trend: Bullish
Sentiment: Oversold (based on 7-period RSI)
Forecast: Bullish
The market is approaching a significant support area 60.422.
The underlined horizontal cluster clearly indicates a highly probable bullish movement

Market Analysis: WTI Crude Faces HurdlesMarket Analysis: WTI Crude Faces Hurdles
Crude oil is showing bearish signs and might decline below $58.80.
Important Takeaways for WTI Crude Oil Price Analysis Today
- Crude oil prices failed to clear the $61.20 region and started a fresh decline.
- There is a bearish trend line forming with

WTI OIL Successive 1D MA50 rejections. Sell Signal.WTI Oil (USOIL) has been trading within a 3-month Channel Down with the price experiencing successive rejection on the 1D MA50 (blue trend-line) since the October 24 Lower High.
Given that the 0.5 Fibonacci retracement level was also filled (as on the previous Lower High), we expect this inability

OIL Rejected Again at Resistance OIL Rejected Again at Resistance: Bears Preparing for Another Push Down
Oil continues to struggle below the 60.50–60.60 resistance zone, where price has been rejected multiple times, confirming selling pressure.
Each test of this zone has led to a swift bearish move — and this time might be no di

Oil analysis — entry trigger is close to being activated.Oil also behaved exactly as we analyzed and the price moved upward, but it is still too early to enter a long position.
In the next analysis, we will review the entry setup.
The Imminent U.S.–Iran Crisis: A Real-Time Analytical AssessmentDate of Analysis: Friday, November 7, 2025
Overview
The following is a condensed version of a dynamic strategic discussion between an intelligent user and an AI assistant. The analysis aimed to decode the hidden layers of a potentially imminent military crisis in the Middle East through real-time

See all ideas
Summarizing what the indicators are suggesting.
Oscillators
Neutral
SellBuy
Strong sellStrong buy
Strong sellSellNeutralBuyStrong buy
Oscillators
Neutral
SellBuy
Strong sellStrong buy
Strong sellSellNeutralBuyStrong buy
Summary
Neutral
SellBuy
Strong sellStrong buy
Strong sellSellNeutralBuyStrong buy
Summary
Neutral
SellBuy
Strong sellStrong buy
Strong sellSellNeutralBuyStrong buy
Summary
Neutral
SellBuy
Strong sellStrong buy
Strong sellSellNeutralBuyStrong buy
Moving Averages
Neutral
SellBuy
Strong sellStrong buy
Strong sellSellNeutralBuyStrong buy
Moving Averages
Neutral
SellBuy
Strong sellStrong buy
Strong sellSellNeutralBuyStrong buy
Displays a symbol's price movements over previous years to identify recurring trends.