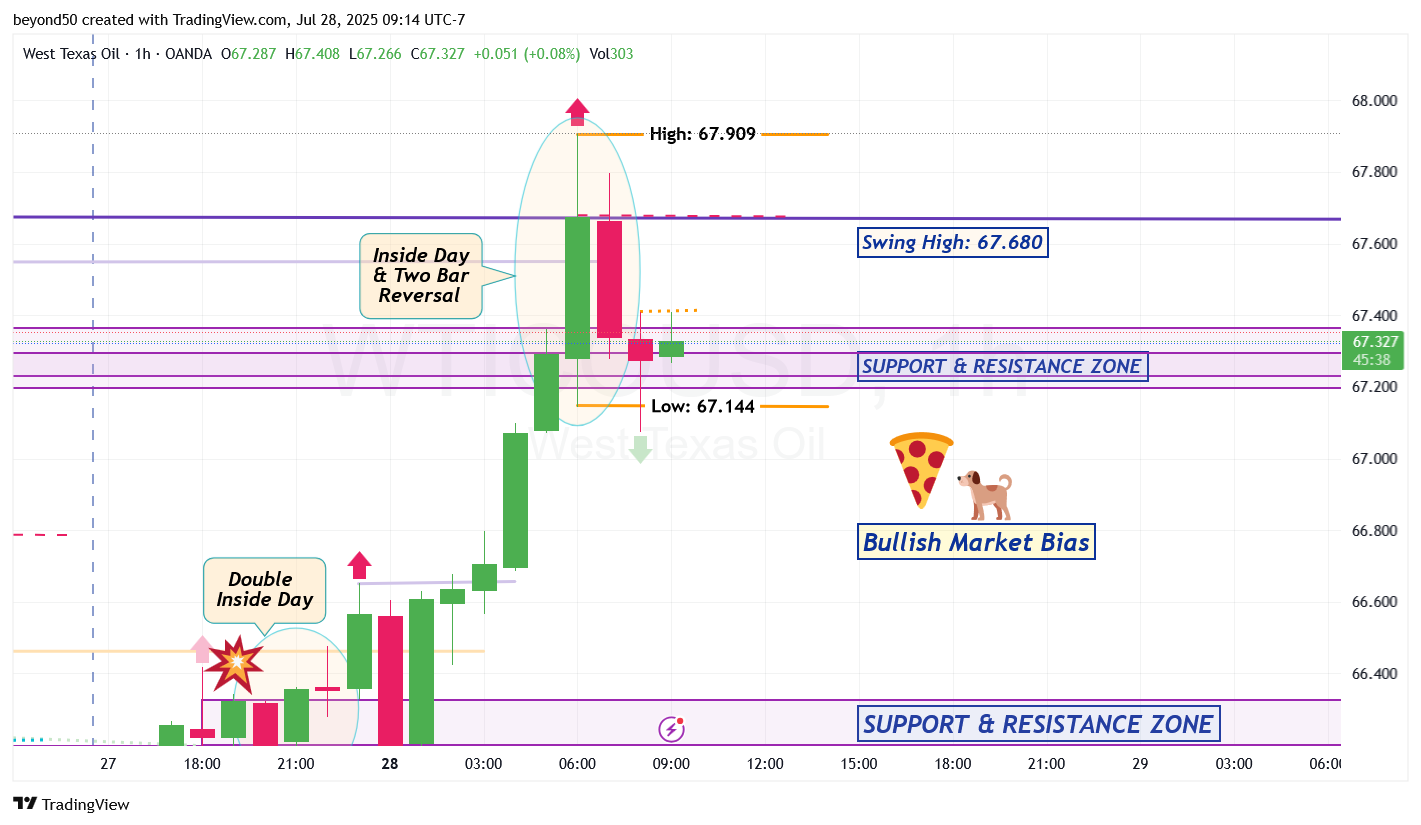
WTICOUSD Special Alert! On the Hourly that is in Bullish (directional) Market Bias, a Double Inside Day pattern showed up. It's a signal telling us that a BIG move is on the way, anytime between soon and within 24-hours from now.
Also, a breakout from the Inside Day pattern's high of 67.989 (shown as an orange line) was rejected, so the bears can now attempt a breakout at the pattern's low of 67.144 (that's shown as an orange line) and drop more towards the Bullish Trendline (in green dotted line).
*Alternative Scenario: If no breakout from the Inside Day pattern's low of 67.144, then the bulls can head back up towards the pattern's high of 67.989.
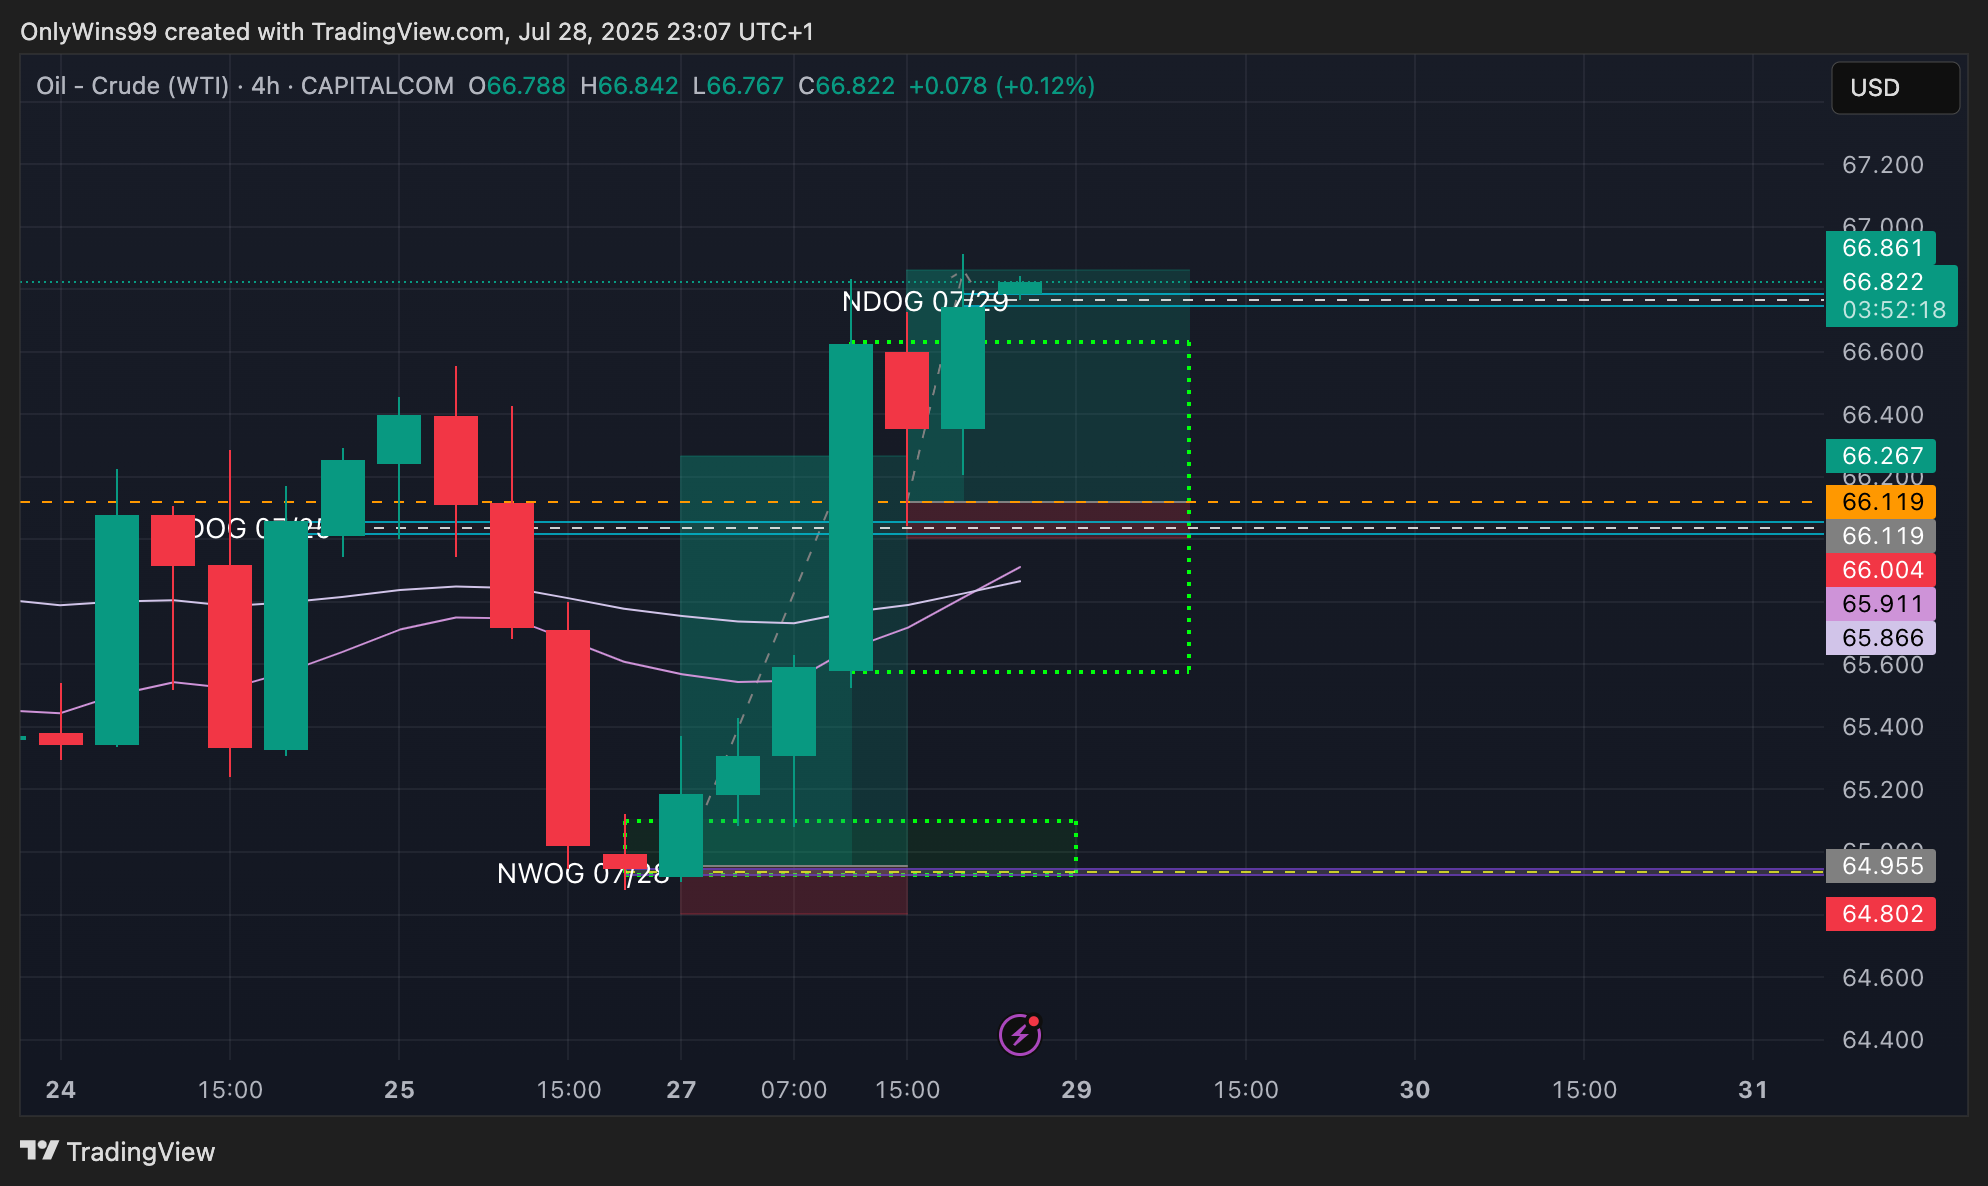
USOIL Market has shifted its structure to the upside, Buy when the price retrace back to the level of 66.07 and it will go the liquidity at the 68.90 zone. tradingview.com/x/MxsLxtGj
OIL_CRUDE just so you know guys. Today oil has bounced from the NDOG created on Friday. We are currently above Thursday NDOG, Friday NDOG and Monday NDOG and also above weekly opening gap. This may potentially be a breakout of the 66 handle and we might not stop until 67.50-68.00 aiming for a swing high before a possible reversal on the market as heavy supply zones and Daily Fair value gap waits ahead.
If I’m exaggerating the targets reversal could happen at 50 ema of the weekly around 68.50 and 68.80
67.50-68 is target and anything above is just liquidity sweep
WTICOUSD Usually after a long trend, which was the bullish one earlier, the market wants to take a pause, which it's doing now.
On the Hourly, the candles are consolidating within an Inside Day pattern, which signifies a market pause with no clear direction until a breakout from either the pattern's high at 67.909 or low of 67.144 (shown as orange lines).
Watch for a true and not a fake breakout. If a fake one, then you'll see an opposite colored candle show up to counter the breakout.