USOIL ANALYSIS SETUP READ THE CAPTIONUSOIL is consolidating above a strong support zone while forming higher lows, indicating bullish pressure building. Price is currently testing the trendline resistance, and a clean breakout could open the way toward the upper target zone. As long as price stays above support, the bullish scenario re
About West Texas Intermediate Crude Oil cash
Crude Oil is a naturally occurring liquid fossil fuel resulting from plants and animals buried underground and exposed to extreme heat and pressure. Crude oil is one of the most demanded commodities and prices have significantly increased in recent times. Two major benchmarks for pricing crude oil are the United States' WTI (West Texas Intermediate) and United Kingdom's Brent. The differences between WTI and Brent include not only price but oil type as well, with WTI producing crude oil with a different density and sulfur content. The demand for crude oil is dependent on global economic conditions as well as market speculation. Crude oil prices are commonly measured in USD. Although there have been discussions of replacing the USD with another trade currency for crude oil, no definitive actions have been taken.

USOIL strong down trend entry on consolidation breakdown USOIL Technical Outlook – 4H Timeframe
USOIL continues to show strong downside momentum, with sellers maintaining control. Price is currently respecting the downtrend structure, and a consolidation breakdown below 59,100 is confirming further bearish pressure.
📉 Key Technical Levels:
Immediate Su

How to Trade Crude Oil with Smart Money Concepts SMC Explained
Smart Money Concepts is one of the most reliable techniques for trading WTI Crude Oil.
In this article, I will teach you a profitable SMC strategy for analysing and trading USOIL futures and CFD.
This simple strategy is based on an important event every SMC trader should know - a break of
USOIL Will Grow! Long!
Please, check our technical outlook for USOIL.
Time Frame: 1D
Current Trend: Bullish
Sentiment: Oversold (based on 7-period RSI)
Forecast: Bullish
The market is approaching a significant support area 60.422.
The underlined horizontal cluster clearly indicates a highly probable bullish movement

BULLISH SCENARIO - USOILHello traders,
USOIL is currently moving inside a descending channel.
A bullish breakout is in focus:
If the price breaks the channel resistance and confirms the close above,
a strong upward movement is expected 🚀
🎯 TARGET: 65.150

OIL Rejected Again at Resistance OIL Rejected Again at Resistance: Bears Preparing for Another Push Down
Oil continues to struggle below the 60.50–60.60 resistance zone, where price has been rejected multiple times, confirming selling pressure.
Each test of this zone has led to a swift bearish move — and this time might be no di

US CRUDE OIL (WTI): Classic Trend-Following Setup I spotted a very classic bullish model on 📈USOIL.
Following a strong bullish wave, the market started to correct within a bullish flag pattern.
The resistance breakout of this pattern consistently provides a reliable confirmation to consider a buy.
I anticipate a rise to 62.50 at this time.

Market Analysis: WTI Crude Oil Extends RecoveryMarket Analysis: WTI Crude Oil Extends Recovery
Crude oil price is rising and it could climb further higher toward $62.00.
Important Takeaways for WTI Crude Oil Price Analysis Today
- WTI Crude oil prices are moving higher above the $60.00 resistance zone.
- There is a key bullish trend line

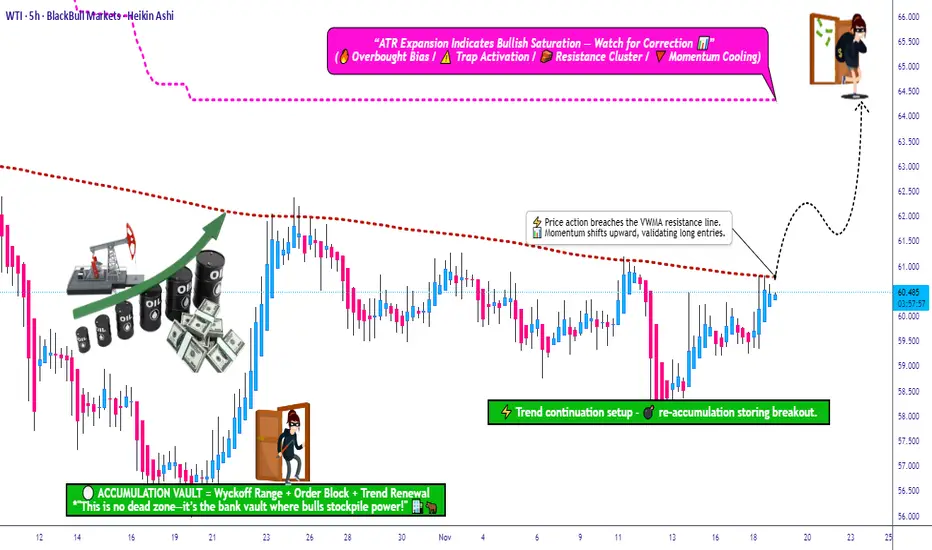
USOIL Breakout Confirmed—Is the Uptrend Ready to Extend?📈 WTI CRUDE OIL (USOIL) – SWING TRADE SETUP | VWMA BREAKOUT CONFIRMED 🛢️⚡
🎯 TRADE OVERVIEW
Asset: WTI Crude Oil (USOIL) – Energies Market
Trade Type: Swing Trade (Multi-Day Position)
Bias: 🟢 BULLISH – Volume Weighted Moving Average (VWMA) breakout confirmed near $61.00
📊 TRADE PLAN
🔹 Entry Strateg
WTI OIL Successive 1D MA50 rejections. Sell Signal.WTI Oil (USOIL) has been trading within a 3-month Channel Down with the price experiencing successive rejection on the 1D MA50 (blue trend-line) since the October 24 Lower High.
Given that the 0.5 Fibonacci retracement level was also filled (as on the previous Lower High), we expect this inability

See all ideas
Displays a symbol's price movements over previous years to identify recurring trends.