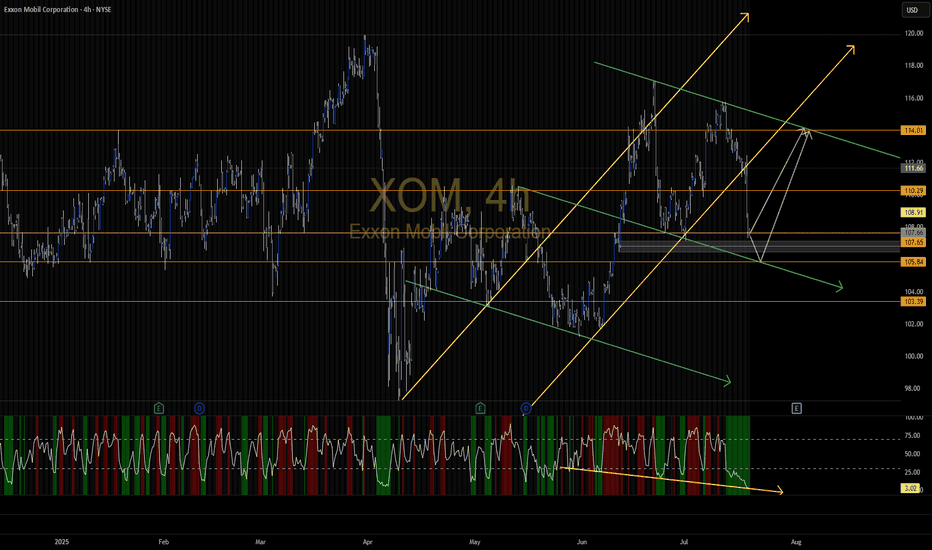
Exxon Stock Chart Fibonacci Analysis 082125Trading Idea
1) Find a FIBO slingshot
2) Check FIBO 61.80% level
3) Entry Point > 108/61.80%
Chart time frame:B
A) 15 min(1W-3M)
B) 1 hr(3M-6M)
C) 4 hr(6M-1year)
D) 1 day(1-3years)
Stock progress:A
A) Keep rising over 61.80% resistance
B) 61.80% resistance
C) 61.80% support
D) Hit the bottom
E)
Key facts today
U.S. and Russian officials discussed Exxon Mobil's possible return to the Sakhalin-1 oil and gas project during peace talks, aiming to encourage Russia's agreement to peace and U.S. sanction relief.
Kazakhstan is seeking a $4.4 billion fine from the NCOC consortium, which includes ExxonMobil, for alleged environmental violations at the Kashagan oilfield.
Exxon Mobil will begin a six-week upgrade of its Beaumont, Texas refinery's crude distillation unit in February 2026. The refinery processes 612,000 barrels daily.
Next report date
—
Report period
—
EPS estimate
—
Revenue estimate
—
6.01 EUR
32.53 B EUR
328.34 B EUR
4.26 B
About Exxon Mobil
Sector
Industry
CEO
Darren W. Woods
Website
Headquarters
Spring
Founded
1882
FIGI
BBG00GQ6S341
Exxon Mobil Corp engages in the exploration, development, and distribution of oil, gas, and petroleum products. It operates through the following segments: Upstream, Downstream and Chemical. The Upstream segment produces crude oil and natural gas. The Downstream segment manufactures and trades petroleum products. The Chemical segment offers petrochemicals. The company was founded by John D. Rockefeller in 1882 and is headquartered in Irving, TX.
Related stocks
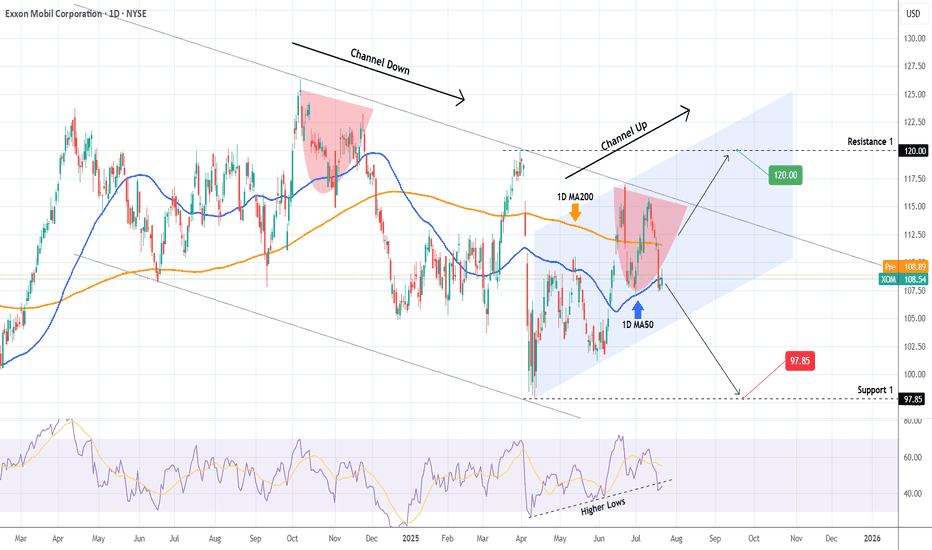
EXXON MOBIL Critical crossroads.Exxon Mobil (XOM) has been trading within a Channel Down since the June 17 2024 Low and just recently on the July 11 2025 High, it made a Lower High pattern similar to November 22 2024.
As long as the price trades below the 1D MA200 (orange trend-line), we expect to start the new Bearish Leg and te
Top-Down Analysis in Action – Live Trade: Where I Enter and WhyIn this video, I walk you through my full trading process – starting with a clean top-down analysis.
I begin on the daily chart to spot key market structure and levels, then zoom in to the 1-hour chart for confirmation, and finally execute my trade on the 5-minute chart.
You’ll see:
✔️ How I define
Exxon Mobil Corporation (XOM) – BUY IDEA📌 We’re watching a strong bullish structure in XOM. After a sharp open, price retraces to fill the GAP and respects the key Low zone 🟧, signaling institutional interest.
🟢 Entry aligns with downside liquidity sweep followed by bullish momentum. This trade has confluence between previous liquidity,
Energy giants surge: Top 5 stocks to watchJune 2025 was marked by heightened volatility across the global energy sector . Amid fluctuating oil prices, geopolitical uncertainty, and ongoing industry transformation, major oil and gas companies delivered mixed results. Let’s break down the key drivers behind the moves in Shell, TotalEnergies,
XOM - Bullish Trade ideaXOM Trade Idea... 🎯 Entry Plan:
Base Entry Zone (accumulation):
ENTRY OPTION 1: $110.60–$111.50 → Retest 12-moving average
ENTRY OPTION 2 momentum trigger: Bullish reversal candle on 2H or 1H + reclaim of $113.00 (this means let price break above $113 after you get a fresh inverse Arc or Level 3
See all ideas
Summarizing what the indicators are suggesting.
Neutral
SellBuy
Strong sellStrong buy
Strong sellSellNeutralBuyStrong buy
Neutral
SellBuy
Strong sellStrong buy
Strong sellSellNeutralBuyStrong buy
Neutral
SellBuy
Strong sellStrong buy
Strong sellSellNeutralBuyStrong buy
An aggregate view of professional's ratings.
Neutral
SellBuy
Strong sellStrong buy
Strong sellSellNeutralBuyStrong buy
Neutral
SellBuy
Strong sellStrong buy
Strong sellSellNeutralBuyStrong buy
Neutral
SellBuy
Strong sellStrong buy
Strong sellSellNeutralBuyStrong buy
Displays a symbol's price movements over previous years to identify recurring trends.
P
PXD5026932
Pioneer Natural Resources Company 1.9% 15-AUG-2030Yield to maturity
—
Maturity date
Aug 15, 2030
P
PXD5562974
Pioneer Natural Resources Company 5.1% 29-MAR-2026Yield to maturity
—
Maturity date
Mar 29, 2026
See all XOM bonds
Curated watchlists where XOM is featured.

Big Oil: Integrated energy companies
10 No. of Symbols

Oil stocks: Liquid black gold
6 No. of Symbols

See all sparks
Frequently Asked Questions
The current price of XOM is 95.61 EUR — it has increased by 0.89% in the past 24 hours. Watch EXXON MOBIL CORP stock price performance more closely on the chart.
Depending on the exchange, the stock ticker may vary. For instance, on VIE exchange EXXON MOBIL CORP stocks are traded under the ticker XOM.
XOM stock has risen by 4.56% compared to the previous week, the month change is a 0.96% rise, over the last year EXXON MOBIL CORP has showed a −8.45% decrease.
We've gathered analysts' opinions on EXXON MOBIL CORP future price: according to them, XOM price has a max estimate of 124.52 EUR and a min estimate of 81.58 EUR. Watch XOM chart and read a more detailed EXXON MOBIL CORP stock forecast: see what analysts think of EXXON MOBIL CORP and suggest that you do with its stocks.
XOM stock is 0.78% volatile and has beta coefficient of 0.47. Track EXXON MOBIL CORP stock price on the chart and check out the list of the most volatile stocks — is EXXON MOBIL CORP there?
Today EXXON MOBIL CORP has the market capitalization of 410.01 B, it has increased by 0.65% over the last week.
Yes, you can track EXXON MOBIL CORP financials in yearly and quarterly reports right on TradingView.
EXXON MOBIL CORP is going to release the next earnings report on Oct 24, 2025. Keep track of upcoming events with our Earnings Calendar.
XOM earnings for the last quarter are 1.39 EUR per share, whereas the estimation was 1.33 EUR resulting in a 4.60% surprise. The estimated earnings for the next quarter are 1.50 EUR per share. See more details about EXXON MOBIL CORP earnings.
EXXON MOBIL CORP revenue for the last quarter amounts to 69.19 B EUR, despite the estimated figure of 68.50 B EUR. In the next quarter, revenue is expected to reach 73.11 B EUR.
XOM net income for the last quarter is 6.01 B EUR, while the quarter before that showed 7.13 B EUR of net income which accounts for −15.67% change. Track more EXXON MOBIL CORP financial stats to get the full picture.
Yes, XOM dividends are paid quarterly. The last dividend per share was 0.85 EUR. As of today, Dividend Yield (TTM)% is 3.51%. Tracking EXXON MOBIL CORP dividends might help you take more informed decisions.
EXXON MOBIL CORP dividend yield was 3.57% in 2024, and payout ratio reached 49.00%. The year before the numbers were 3.68% and 41.41% correspondingly. See high-dividend stocks and find more opportunities for your portfolio.
As of Aug 26, 2025, the company has 61 K employees. See our rating of the largest employees — is EXXON MOBIL CORP on this list?
EBITDA measures a company's operating performance, its growth signifies an improvement in the efficiency of a company. EXXON MOBIL CORP EBITDA is 52.16 B EUR, and current EBITDA margin is 18.76%. See more stats in EXXON MOBIL CORP financial statements.
Like other stocks, XOM shares are traded on stock exchanges, e.g. Nasdaq, Nyse, Euronext, and the easiest way to buy them is through an online stock broker. To do this, you need to open an account and follow a broker's procedures, then start trading. You can trade EXXON MOBIL CORP stock right from TradingView charts — choose your broker and connect to your account.
Investing in stocks requires a comprehensive research: you should carefully study all the available data, e.g. company's financials, related news, and its technical analysis. So EXXON MOBIL CORP technincal analysis shows the buy rating today, and its 1 week rating is neutral. Since market conditions are prone to changes, it's worth looking a bit further into the future — according to the 1 month rating EXXON MOBIL CORP stock shows the sell signal. See more of EXXON MOBIL CORP technicals for a more comprehensive analysis.
If you're still not sure, try looking for inspiration in our curated watchlists.
If you're still not sure, try looking for inspiration in our curated watchlists.


