False Breakout Above Triangle — Expecting Real Breakdown to 0.25Price has been compressing inside a large symmetrical triangle for an extended period. Recently, we saw a false breakout to the upside , which was quickly rejected and followed by a return back inside the structure — a classic sign of bull trap.
At the moment, price is holding near the lower bou
Related pairs

$VIRTUALUSDT — $0.6950–$0.7650 Demand Zone to Decide the Next.BINANCE:VIRTUALUSDT is developing a clean bullish structure after a decisive Change of Character (CHOCH) and multiple Break of Structure (BOS) confirmations. Price has now pulled back into the key buying zone at $0.6950–$0.7650, which will determine whether the bullish trend continuation plays out.

VIRTUAL has formed an inverted head and shoulders pattern🚨📊 VIRTUAL Update
VIRTUAL has formed an inverted head and shoulders pattern,
a bullish reversal setup.
Price is now testing the red resistance zone 🔴,
which is the key confirmation level.
A breakout above this zone could trigger
strong bullish continuation.
Watching closely for confirmation. 👀

Most Traders Will Lose Their Money Here80% of traders lose money in crypto, and it’s not because of bad analysis. It’s because they don’t understand emotion.
Right now, we’re in the exact phase of the market where most mistakes happen. Price moves lower, portfolios turn red, and traders panic out of positions, often at the worst possibl

virtualusdthi all.
the price is looking good, the market is stable, and everything is ok. so i think we can make a good profit in low risk...

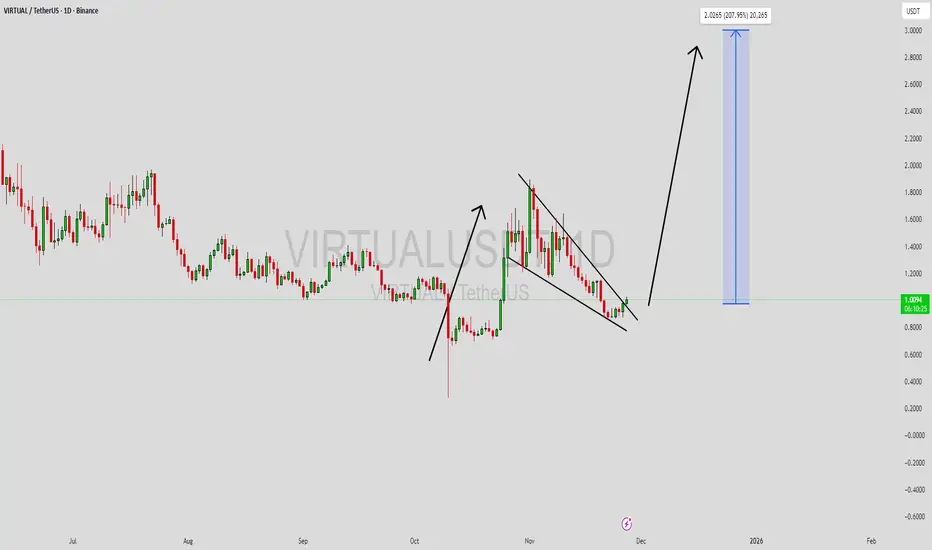
$VIRTUAL/USDT ANALYSISOn the 4-hour chart of **VIRTUAL/USDT**, price has been moving inside a clear **descending channel** since mid-November, making lower highs and lower lows. Recently, price rebounded from the lower trendline and is now testing the upper boundary of the channel near **$0.98–$1.00**. The candle structu

VIRTUALUSDT Forming Falling WedgeVIRTUALUSDT is forming a clear falling wedge pattern, a classic bullish reversal signal that often indicates an upcoming breakout. The price has been consolidating within a narrowing range, suggesting that selling pressure is weakening while buyers are beginning to regain control. With consistent vo
VIRTUALUSDT 1D#VIRTUAL pulled back to retest the previously broken descending resistance, and so far the retest has been successful. It is currently battling the daily SMA50, while the broken descending resistance has now turned into support alongside the Ichimoku cloud. If the price breaks above the SMA50, the p

$VIRTUAL Update📊 SPARKS:VIRTUAL Update
SPARKS:VIRTUAL is testing the red resistance zone 🔴
If it breaks out above, it could confirm a bullish setup 📈
The first target would be the green line level 🟢

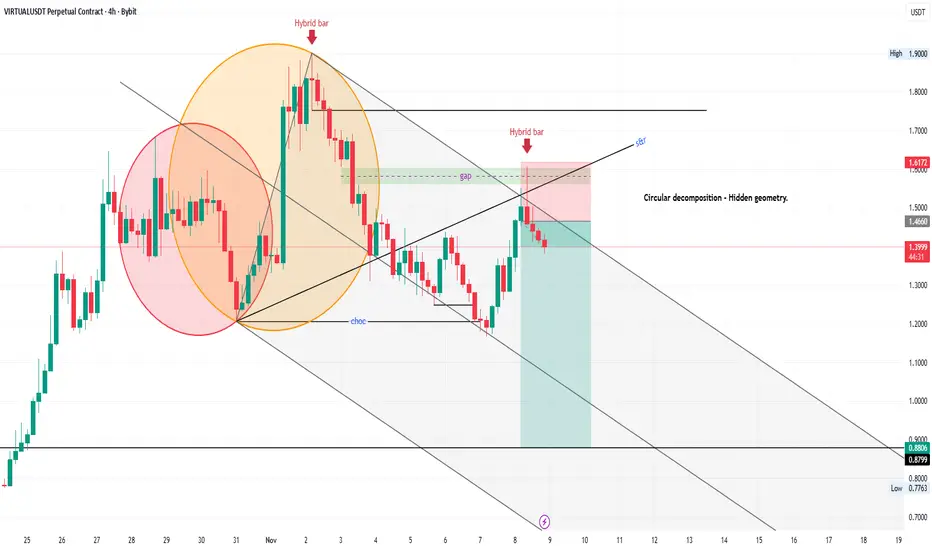
VIRTUALUSDTI employ a method known as Circular Decomposition, paired with Andrew's pitchfork, to identify potential price continuations when the market doesn't reach the previous high.
See all ideas
Summarizing what the indicators are suggesting.
Oscillators
Neutral
SellBuy
Strong sellStrong buy
Strong sellSellNeutralBuyStrong buy
Oscillators
Neutral
SellBuy
Strong sellStrong buy
Strong sellSellNeutralBuyStrong buy
Summary
Neutral
SellBuy
Strong sellStrong buy
Strong sellSellNeutralBuyStrong buy
Summary
Neutral
SellBuy
Strong sellStrong buy
Strong sellSellNeutralBuyStrong buy
Summary
Neutral
SellBuy
Strong sellStrong buy
Strong sellSellNeutralBuyStrong buy
Moving Averages
Neutral
SellBuy
Strong sellStrong buy
Strong sellSellNeutralBuyStrong buy
Moving Averages
Neutral
SellBuy
Strong sellStrong buy
Strong sellSellNeutralBuyStrong buy
Displays a symbol's price movements over previous years to identify recurring trends.
Frequently Asked Questions
The current price of VIRTUALUSDT SPOT (VIRTUAL) is 0.7152 USDT — it has risen 0.25% in the past 24 hours. Try placing this info into the context by checking out what coins are also gaining and losing at the moment and seeing VIRTUAL price chart.
VIRTUALUSDT SPOT price has fallen by −10.99% over the last week, its month performance shows a −37.90% decrease, and as for the last year, VIRTUALUSDT SPOT has decreased by −68.50%. See more dynamics on VIRTUAL price chart.
Keep track of coins' changes with our Crypto Coins Heatmap.
Keep track of coins' changes with our Crypto Coins Heatmap.
VIRTUALUSDT SPOT (VIRTUAL) reached its highest price on Jan 2, 2025 — it amounted to 5.1450 USDT. Find more insights on the VIRTUAL price chart.
See the list of crypto gainers and choose what best fits your strategy.
See the list of crypto gainers and choose what best fits your strategy.
VIRTUALUSDT SPOT (VIRTUAL) reached the lowest price of 0.2843 USDT on Oct 10, 2025. View more VIRTUALUSDT SPOT dynamics on the price chart.
See the list of crypto losers to find unexpected opportunities.
See the list of crypto losers to find unexpected opportunities.
The safest choice when buying VIRTUAL is to go to a well-known crypto exchange. Some of the popular names are Binance, Coinbase, Kraken. But you'll have to find a reliable broker and create an account first. You can trade VIRTUAL right from TradingView charts — just choose a broker and connect to your account.
Crypto markets are famous for their volatility, so one should study all the available stats before adding crypto assets to their portfolio. Very often it's technical analysis that comes in handy. We prepared technical ratings for VIRTUALUSDT SPOT (VIRTUAL): today its technical analysis shows the sell signal, and according to the 1 week rating VIRTUAL shows the sell signal. And you'd better dig deeper and study 1 month rating too — it's sell. Find inspiration in VIRTUALUSDT SPOT trading ideas and keep track of what's moving crypto markets with our crypto news feed.
VIRTUALUSDT SPOT (VIRTUAL) is just as reliable as any other crypto asset — this corner of the world market is highly volatile. Today, for instance, VIRTUALUSDT SPOT is estimated as 5.15% volatile. The only thing it means is that you must prepare and examine all available information before making a decision. And if you're not sure about VIRTUALUSDT SPOT, you can find more inspiration in our curated watchlists.
You can discuss VIRTUALUSDT SPOT (VIRTUAL) with other users in our public chats, Minds or in the comments to Ideas.