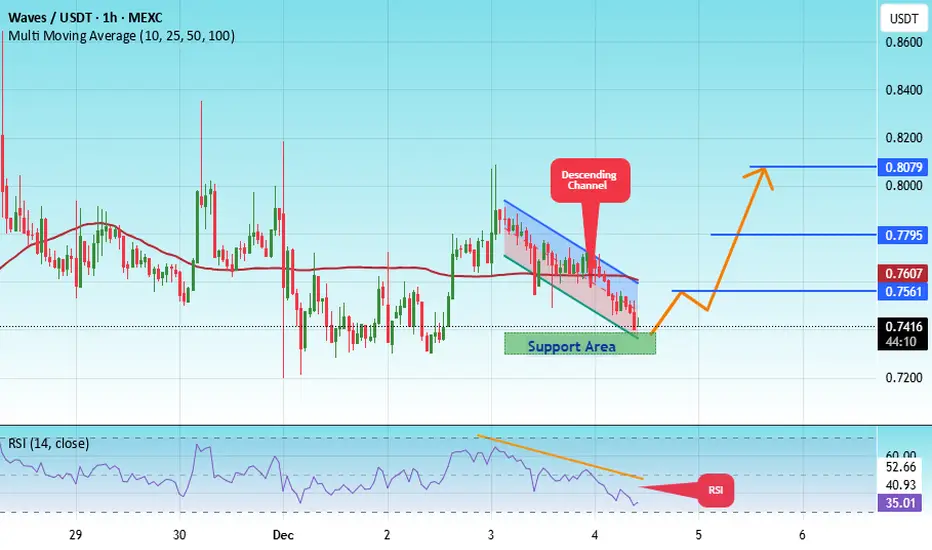
#WAVES/USDT is currently strongly bullish#WAVES
The price is moving in a descending channel on the 1-hour timeframe. It has reached the lower boundary and is heading towards breaking above it, with a retest of the upper boundary expected.
We have a downtrend on the RSI indicator, which has reached near the lower boundary, and an upward r
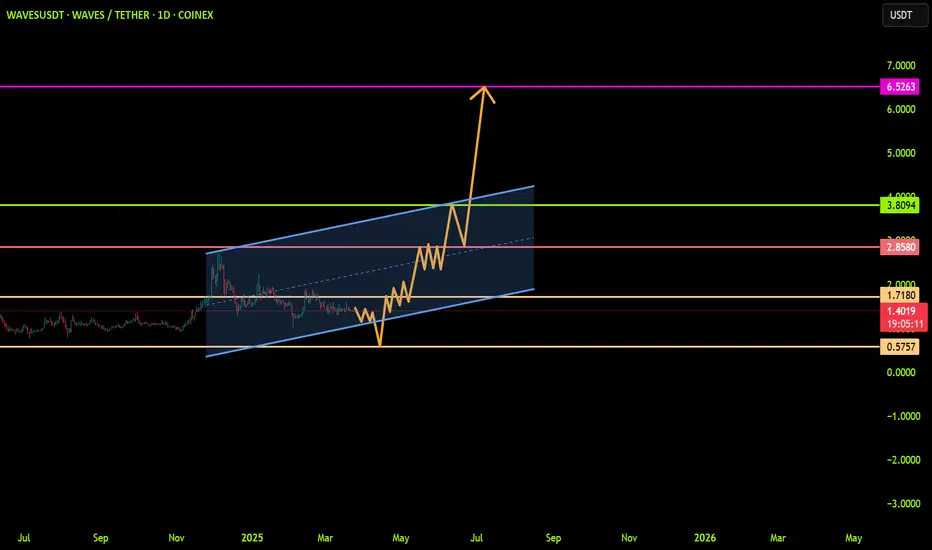
WAVESUSDT: Trend in daily time framePlease pay special attention to the very accurate trend, and colored levels.
Its a very sensitive setup, please be careful.
BEST,
MT

“WAVES Approaching Major Resistance – Possible Bullish Move”WAVES is currently trading inside a symmetrical triangle pattern. Price is consolidating and approaching the apex, which usually leads to a strong breakout.
Safety Zone: ₹95–100 range, holding support.
1st Breakout Level: Around ₹120–125. If this breaks, price can rally further.
Main Breakout (Bu

WAVES/USDT BREAK 3.0There is good chance for wave break and focus goes there to check it in the coming time frames.
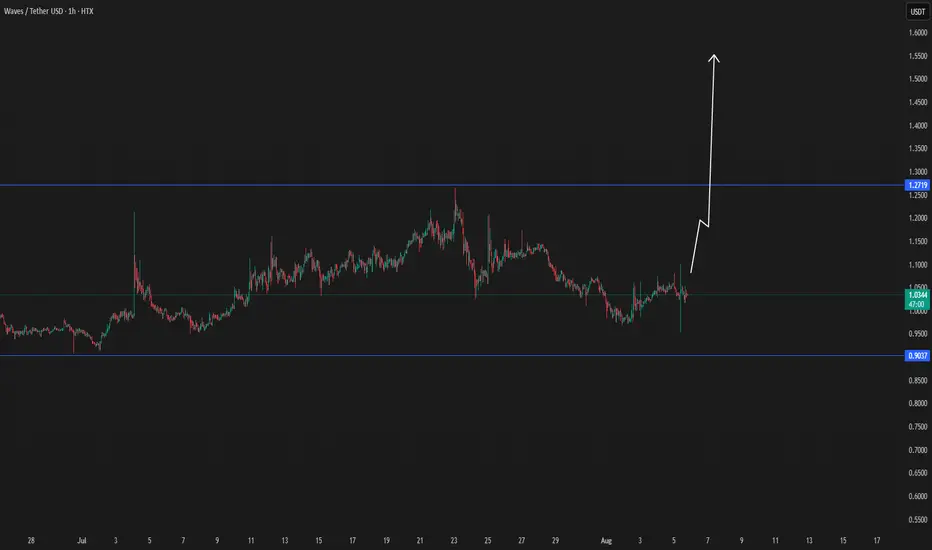
WAVES ON WAY TO $2waves have a high chance to enter a new break to 2 usd, since the last data.
When there is more confirmation, the updates will be below.

WAVESUSDT - Upward Target LevelsListed a few bull targets once this breakout of the falling wedge pattern occurs
Hopefully these levels are reached and the previous ATH is eclipsed
Falling wedge is a bullish pattern, lets see where it goes
Weekly chart

WAVES Falling WedgeA falling wedge pattern during the bear market
This is a bullish pattern suggesting a breakout once completed
Very cheap right now for WAVES
Chart pattern analyses on this Daily timeframe

Long Entry on WAVESUSDT with PSAR Stop LossBased on the daily chart for WAVESUSDT on Bybit, we've identified a bullish setup for a long entry:
Indicators Used:
MLR (Moving Regression Line) in blue
SMA (Simple Moving Average) in pink
BB Center Line (Bollinger Bands Center Line) in orange
PSAR (Parabolic SAR) in black dots
200-period SMA in

wave ready to up1. break out daily trend and complete pullback.
2. daily vol increase.
tp1 = 2.45
tp2 = 3.5

See all ideas
Summarizing what the indicators are suggesting.
Oscillators
Neutral
SellBuy
Strong sellStrong buy
Strong sellSellNeutralBuyStrong buy
Oscillators
Neutral
SellBuy
Strong sellStrong buy
Strong sellSellNeutralBuyStrong buy
Summary
Neutral
SellBuy
Strong sellStrong buy
Strong sellSellNeutralBuyStrong buy
Summary
Neutral
SellBuy
Strong sellStrong buy
Strong sellSellNeutralBuyStrong buy
Summary
Neutral
SellBuy
Strong sellStrong buy
Strong sellSellNeutralBuyStrong buy
Moving Averages
Neutral
SellBuy
Strong sellStrong buy
Strong sellSellNeutralBuyStrong buy
Moving Averages
Neutral
SellBuy
Strong sellStrong buy
Strong sellSellNeutralBuyStrong buy
Displays a symbol's price movements over previous years to identify recurring trends.