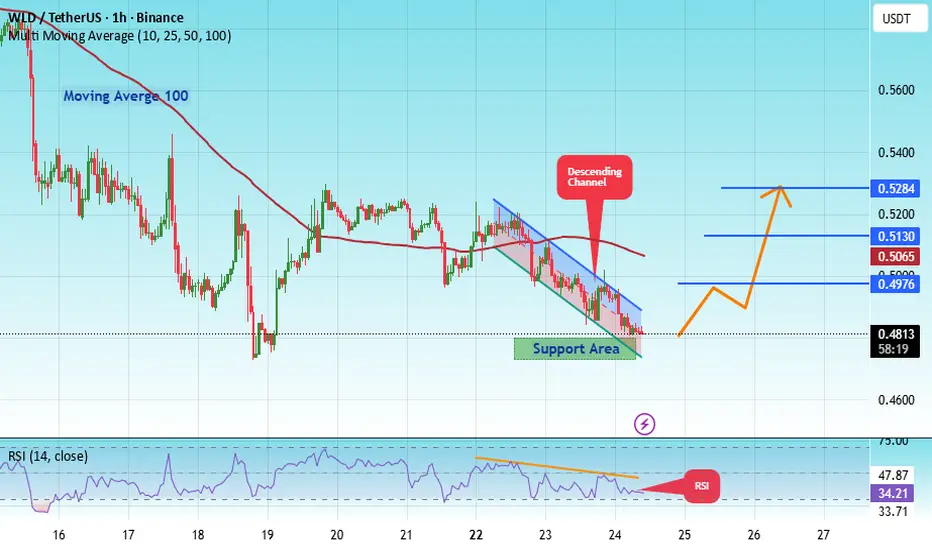
#WLD/USDT Pump Anticipated#WLD
The price is moving in a descending channel on the 1-hour timeframe. It has reached the lower boundary and is heading towards breaking above it, with a retest of the upper boundary expected.
We have a downtrend on the RSI indicator, which has reached near the lower boundary, and an upward reb

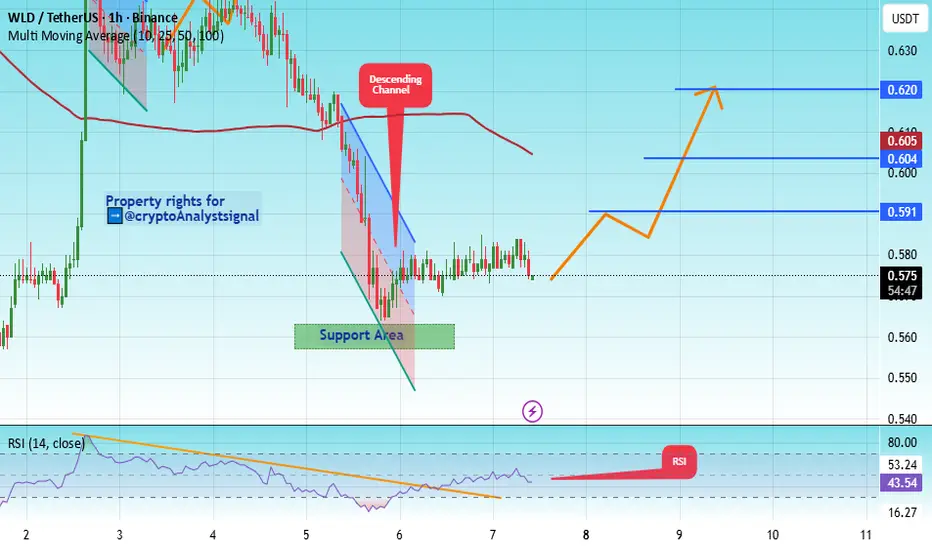
#WLD/USDT LONG SET UP ALERT#WLD
The price is moving in a descending channel on the 1-hour timeframe. It has reached the lower boundary and is heading towards a breakout, with a retest of the upper boundary expected.
We are seeing a bearish trend in the Relative Strength Index (RSI), which has reached near the lower boundary

FireHoseReel | WLD at a Major Decision Zone Range Break Incoming🔥 Welcome To FireHoseReel !
Let’s dive into Worldcoin (WLD) analysis.
⛳️ WLD Fundamental Overview
Worldcoin (WLD) is a digital identity and crypto project using biometric proof of personhood. Ranked #52 on CoinMarketCap, it has ~2.58B circulating supply, ~$1.24B market cap, and steady daily volume.

#WLD/USDT Pump Anticipated#WLD
The price is moving in a descending channel on the 1-hour timeframe. It has reached the lower boundary and is heading towards breaking above it, with a retest of the upper boundary expected.
We have a downtrend on the RSI indicator, which has reached near the lower boundary, and an upward reb
WLD Update📊 WLD Update
WLD moved back above the blue support level 🔵,
but failed to hold and broke back below.
This failed hold signals weakness,
and sellers have regained control.
As long as price stays below this zone,
downside risk remains elevated and the trend stays weak.

#WLD/USDT Pump Anticipated#WLD
The price is moving in a descending channel on the 1-hour timeframe. It has reached the lower boundary and is heading towards a breakout, with a retest of the upper boundary expected.
We are seeing a bearish bias in the Relative Strength Index (RSI), which has reached near the lower boundary,

WLDUSDT 1D#WLD has broken above the descending resistance on the daily chart. It may retest the trendline before the next leg up, so consider buying a small bag here and another on the retest. The potential upside targets are:
🎯 $0.724
🎯 $0.830
🎯 $0.916
🎯 $1.002
🎯 $1.124
🎯 $1.279
⚠️ Always remember to use a

#WLD/USDT Pump Anticipated#WLD
The price is moving in a descending channel on the 1-hour timeframe. It has reached the lower boundary and is heading towards breaking above it, with a retest of the upper boundary expected.
We have a downtrend on the RSI indicator, which has reached near the lower boundary, and an upward reb
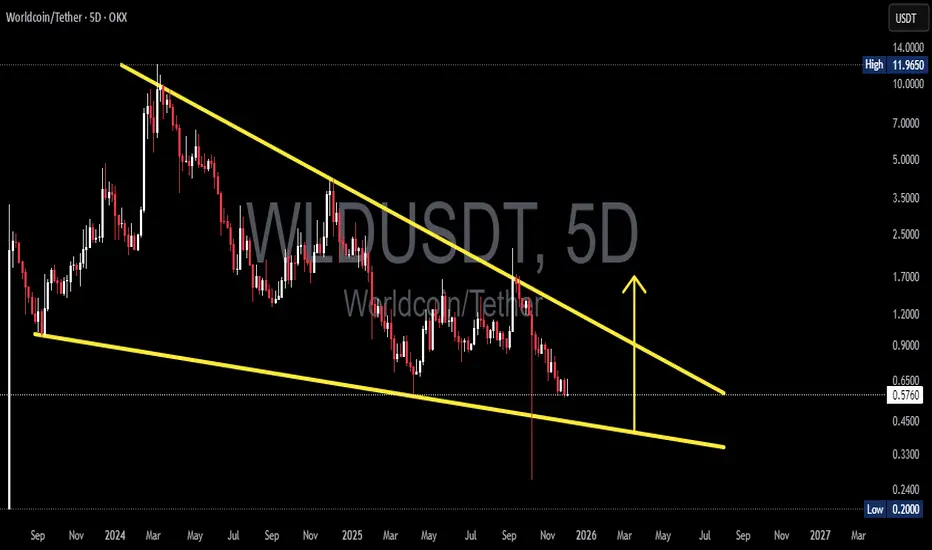
WLD/USDT — Falling Wedge: : Reversal or Final Capitulation?WLD/USDT on the 5D timeframe is entering the most critical phase of its long-term structure. Price action has formed a large Falling Wedge, a classic pattern that appears when bearish momentum fades while smart money quietly accumulates liquidity.
The upper trendline continues to slope downward sha
#WLD/USDT Pump Anticipated#WLD
The price is moving in a descending channel on the 1-hour timeframe. It has reached the lower boundary and is heading towards breaking above it, with a retest of the upper boundary expected.
We have a downtrend on the RSI indicator, which has reached near the lower boundary, and an upward reb

See all ideas
Summarizing what the indicators are suggesting.
Oscillators
Neutral
SellBuy
Strong sellStrong buy
Strong sellSellNeutralBuyStrong buy
Oscillators
Neutral
SellBuy
Strong sellStrong buy
Strong sellSellNeutralBuyStrong buy
Summary
Neutral
SellBuy
Strong sellStrong buy
Strong sellSellNeutralBuyStrong buy
Summary
Neutral
SellBuy
Strong sellStrong buy
Strong sellSellNeutralBuyStrong buy
Summary
Neutral
SellBuy
Strong sellStrong buy
Strong sellSellNeutralBuyStrong buy
Moving Averages
Neutral
SellBuy
Strong sellStrong buy
Strong sellSellNeutralBuyStrong buy
Moving Averages
Neutral
SellBuy
Strong sellStrong buy
Strong sellSellNeutralBuyStrong buy
Displays a symbol's price movements over previous years to identify recurring trends.