Wormhole to da moonWormhole did not just accumulate for 180 days to pump and dump around this zone. Q1 is going to be awesome for W accumulations.
First two targets are very conservative, will be playing step by step.
Box zone determines bullishness
Wormhole is going to be one of the coins to talk during 2025.
Merry Christmas!
Market insights

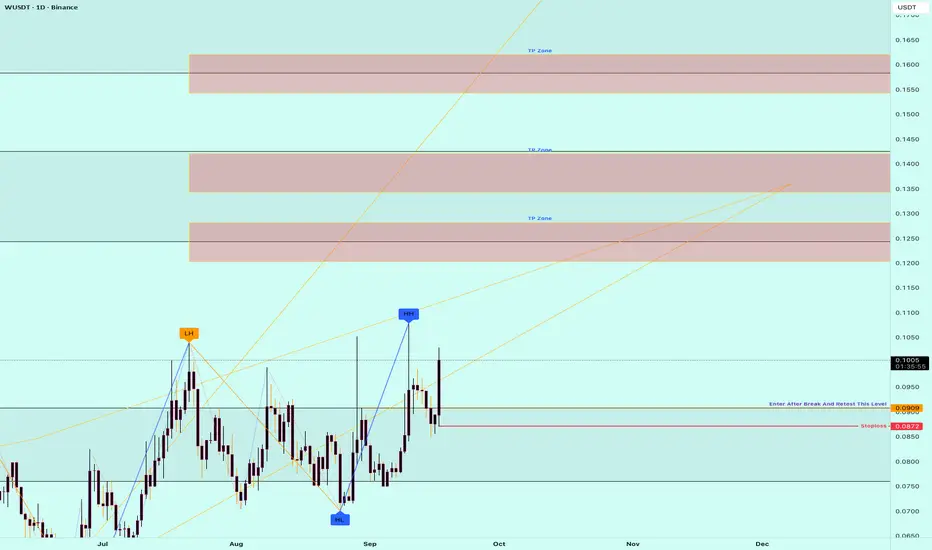
WUSDT 1D#W is holding above the broken descending resistance on the daily chart, and a bounce is expected from here. For the bullish scenario to be confirmed, it needs to reclaim the daily SMA200. If that happens, the potential targets are:
🎯 $0.1006
🎯 $0.1294
🎯 $0.1526
🎯 $0.1758
🎯 $0.2089
🎯 $0.2510
⚠️ Always remember to use a tight stop-loss and maintain proper risk management.

WUSDT | Turning BullishW/USDT is showing strong signs of reversal momentum. A clear Inverse Head & Shoulders pattern has been completed, with the neckline breakout suggesting a potential bullish trend shift. Price is consolidating near the neckline, which is now acting as support, adding strength to the breakout.
If momentum sustains, the next upside targets open toward $0.19 – $0.29, with an extended bullish potential toward $1.85 in the long run. On the downside, support is seen around $0.061 – $0.049, keeping risk-to-reward highly attractive for medium to long-term investors.

Potential reversal on WormholeWe have seen the first half of the reversal diamond pattern play out and will be looking at this filling the second part with in the first 4 months of 2026 if not sooner..

#W Bullish Head and Shoulders 📊 #W Bullish Head and Shoulders 🚀
🧠From a structural perspective, we've formed a bullish head and shoulders pattern at the bottom, currently testing the neckline support area and the uptrend support line. If we can hold here, there's a high probability of a further breakout from here.
Let's see 👀
🤜If you like my analysis, please like 💖 and share 💬
BITGET:WUSDT.P

W Secondary. Reversed Head and Shoulders Key Area. 18 09 25Logarithm. 3 days.
Main trend 23 03 2025
A breakout of the previously mentioned key resistance (pair to USD) occurs on huge buying volume and an exit from the sideways trend (inverse head and shoulders).
Local targets, in case the inverse head and shoulders pattern is realized and a bowl forms at the next resistance level (previous consolidation).

WUSDT UPDATE#W
UPDATE
W Technical Setup
Pattern: Bullish Falling Wedge Pattern
Current Price: $0.2145
Target Price: $0.3010
Target % Gain: 110.29%
$W is breaking out of a falling wedge pattern on the 1D timeframe. Current price is $0.2145 with a target near $0.3010, showing about 40% potential upside. The breakout confirms bullish momentum with structure favoring continuation. Always use proper risk management.
Time Frame: 1D
Risk Management Tip: Always use proper risk management.

WUSDT UPDATE#W
UPDATE
W Technical Setup
Pattern: Bullish Falling Wedge Pattern
Current Price: $0.2145
Target Price: $0.3010
Target % Gain: 40.29%
$W is breaking out of a falling wedge pattern on the 1D timeframe. Current price is $0.2145 with a target near $0.3010, showing about 40% potential upside. The breakout confirms bullish momentum with structure favoring continuation. Always use proper risk management.
Time Frame: 1D
Risk Management Tip: Always use proper risk management.

#W (Spot)BINANCE:WUSDT
#W/ USDT
Entry range (0.0750- 0.0850)
SL 1D close below 0.070
T1 0.1200
T2 0.1600
T3 0.2300
Extra Target is optional 0.3000
_______________________________________________________
Golden Advices.
********************
* collect the coin slowly in the entry range.
* Please calculate your losses before the entry.
* Do not enter any trade you find it not suitable for you.
* No FOMO - No Rush , it is a long journey.

$WUSDT Breakout: 269% Potential Ahead!$W just broke past a major resistance level, setting its sights on 0.4075, which could mean a massive 269% Gain.
After a long downtrend, it's finally showing some serious bullish momentum.
If this continues, we could see some big moves heading into October.
DYOR, NFA

WUSDT | Green Box as Intraday EntryOn WUSDT, the green box is a clear support zone identified on the 1-hour chart. It doesn’t shift the overall trend — but it does offer a tactical entry point.
Here’s what I see:
Buyers have shown activity in this area before, suggesting it can still act as demand.
I expect a short-term reaction, in the range of 5–10%, if the zone holds.
For conviction, I’ll be watching low timeframe breaks with CDV divergence and a touch of footprint absorption inside the zone.
This is not a trend reversal signal, just a high-probability bounce setup for traders with tight risk management.
📌I keep my charts clean and simple because I believe clarity leads to better decisions.
📌My approach is built on years of experience and a solid track record. I don’t claim to know it all but I’m confident in my ability to spot high-probability setups.
📌If you would like to learn how to use the heatmap, cumulative volume delta and volume footprint techniques that I use below to determine very accurate demand regions, you can send me a private message. I help anyone who wants it completely free of charge.
🔑I have a long list of my proven technique below:
🎯 ZENUSDT.P: Patience & Profitability | %230 Reaction from the Sniper Entry
🐶 DOGEUSDT.P: Next Move
🎨 RENDERUSDT.P: Opportunity of the Month
💎 ETHUSDT.P: Where to Retrace
🟢 BNBUSDT.P: Potential Surge
📊 BTC Dominance: Reaction Zone
🌊 WAVESUSDT.P: Demand Zone Potential
🟣 UNIUSDT.P: Long-Term Trade
🔵 XRPUSDT.P: Entry Zones
🔗 LINKUSDT.P: Follow The River
📈 BTCUSDT.P: Two Key Demand Zones
🟩 POLUSDT: Bullish Momentum
🌟 PENDLEUSDT.P: Where Opportunity Meets Precision
🔥 BTCUSDT.P: Liquidation of Highly Leveraged Longs
🌊 SOLUSDT.P: SOL's Dip - Your Opportunity
🐸 1000PEPEUSDT.P: Prime Bounce Zone Unlocked
🚀 ETHUSDT.P: Set to Explode - Don't Miss This Game Changer
🤖 IQUSDT: Smart Plan
⚡️ PONDUSDT: A Trade Not Taken Is Better Than a Losing One
💼 STMXUSDT: 2 Buying Areas
🐢 TURBOUSDT: Buy Zones and Buyer Presence
🌍 ICPUSDT.P: Massive Upside Potential | Check the Trade Update For Seeing Results
🟠 IDEXUSDT: Spot Buy Area | %26 Profit if You Trade with MSB
📌 USUALUSDT: Buyers Are Active + %70 Profit in Total
🌟 FORTHUSDT: Sniper Entry +%26 Reaction
🐳 QKCUSDT: Sniper Entry +%57 Reaction
📊 BTC.D: Retest of Key Area Highly Likely
📊 XNOUSDT %80 Reaction with a Simple Blue Box!
📊 BELUSDT Amazing %120 Reaction!
📊 Simple Red Box, Extraordinary Results
📊 TIAUSDT | Still No Buyers—Maintaining a Bearish Outlook
📊 OGNUSDT | One of Today’s Highest Volume Gainers – +32.44%
📊 TRXUSDT - I Do My Thing Again
📊 FLOKIUSDT - +%100 From Blue Box!
📊 SFP/USDT - Perfect Entry %80 Profit!
📊 AAVEUSDT - WE DID IT AGAIN!
I stopped adding to the list because it's kinda tiring to add 5-10 charts in every move but you can check my profile and see that it goes on..

W (Walmart) – Technical Outlook with Key Support & Resistance LeDescription:
Walmart Inc. (NYSE: W) is one of the world’s leading retail corporations, known for its strong revenue streams and defensive positioning in the consumer sector. Despite global market challenges, Walmart has shown resilience supported by steady fundamentals, stable cash flow, and consistent dividend history.
This chart highlights important technical zones, focusing on trend dynamics, support, and resistance levels that could shape upcoming market behavior. Both long-term investors and short-term traders may find key signals worth monitoring.
⚠️ Disclaimer: This is not financial advice. The content is for educational and informational purposes only. Always do your own research before making investment decisions.
#Walmart #W #StockMarket #TechnicalAnalysis #Retail #NYSE #TradingView #Investing #Stocks
W/USDT continues to move within a well-defined descending chann🔻 The price has dropped around –96% from its all-time high.
That doesn’t guarantee a bottom — but further downside is no longer a given.
🚫 Opening shorts in this zone looks questionable,
especially considering the broader altcoin market structure.
📊 A more strategic approach would be to trade from the average price,
targeting a potential return to key resistance levels.
🎯 A bullish scenario points toward a move to the top of the channel,
with a potential +100% upside from current levels.
🪙 Worth noting: a major token unlock took place back in April —
those tokens are already in circulation, which reduces selling pressure.
📌 Still, a drop to the lower channel support can’t be ruled out —
this area should be considered in any risk-managed strategy.

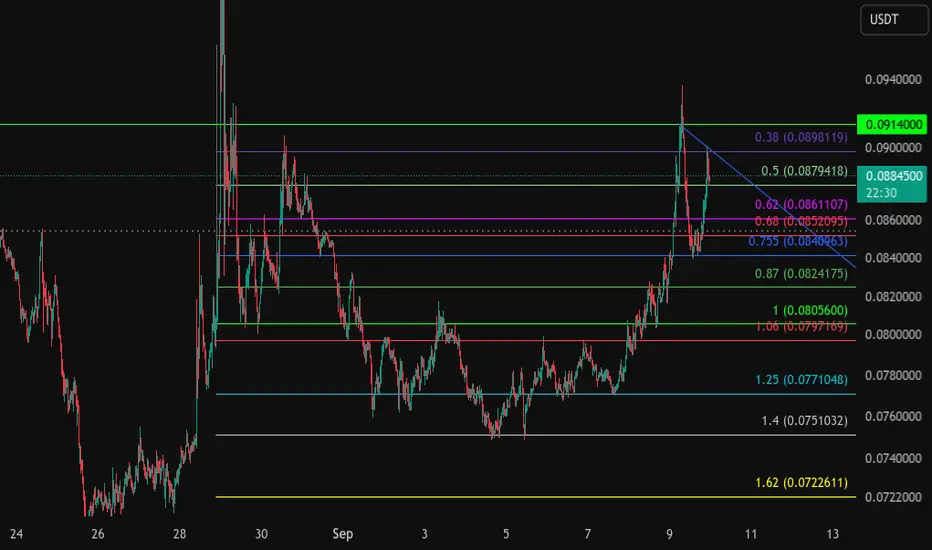
W/USDTKey Level Zone: 0.08800 - 0.09000
LMT v2.0 detected.
The setup looks promising—price previously trended upward with rising volume and momentum, then retested this zone cleanly. This presents an excellent reward-to-risk opportunity if momentum continues to align.
Introducing LMT (Levels & Momentum Trading)
- Over the past 3 years, I’ve refined my approach to focus more sharply on the single most important element in any trade: the KEY LEVEL.
- While HMT (High Momentum Trading) served me well—combining trend, momentum, volume, and structure across multiple timeframes—I realized that consistently identifying and respecting these critical price zones is what truly separates good trades from great ones.
- That insight led to the evolution of HMT into LMT – Levels & Momentum Trading.
Why the Change? (From HMT to LMT)
Switching from High Momentum Trading (HMT) to Levels & Momentum Trading (LMT) improves precision, risk control, and confidence by:
- Clearer Entries & Stops: Defined key levels make it easier to plan entries, stop-losses, and position sizing—no more guesswork.
- Better Signal Quality: Momentum is now always checked against a support or resistance zone—if it aligns, it's a stronger setup.
- Improved Reward-to-Risk: All trades are anchored to key levels, making it easier to calculate and manage risk effectively.
- Stronger Confidence: With clear invalidation points beyond key levels, it's easier to trust the plan and stay disciplined—even in tough markets.
Whenever I share a signal, it’s because:
- A high‐probability key level has been identified on a higher timeframe.
- Lower‐timeframe momentum, market structure and volume suggest continuation or reversal is imminent.
- The reward‐to‐risk (based on that key level) meets my criteria for a disciplined entry.
***Please note that conducting a comprehensive analysis on a single timeframe chart can be quite challenging and sometimes confusing. I appreciate your understanding of the effort involved.
Important Note: The Role of Key Levels
- Holding a key level zone: If price respects the key level zone, momentum often carries the trend in the expected direction. That’s when we look to enter, with stop-loss placed just beyond the zone with some buffer.
- Breaking a key level zone: A definitive break signals a potential stop‐out for trend traders. For reversal traders, it’s a cue to consider switching direction—price often retests broken zones as new support or resistance.
My Trading Rules (Unchanged)
Risk Management
- Maximum risk per trade: 2.5%
- Leverage: 5x
Exit Strategy / Profit Taking
- Sell at least 70% on the 3rd wave up (LTF Wave 5).
- Typically sell 50% during a high‐volume spike.
- Move stop‐loss to breakeven once the trade achieves a 1.5:1 R:R.
- Exit at breakeven if momentum fades or divergence appears.
The market is highly dynamic and constantly changing. LMT signals and target profit (TP) levels are based on the current price and movement, but market conditions can shift instantly, so it is crucial to remain adaptable and follow the market's movement.
If you find this signal/analysis meaningful, kindly like and share it.
Thank you for your support~
Sharing this with love!
From HMT to LMT: A Brief Version History
HM Signal :
Date: 17/08/2023
- Early concept identifying high momentum pullbacks within strong uptrends
- Triggered after a prior wave up with rising volume and momentum
- Focused on healthy retracements into support for optimal reward-to-risk setups
HMT v1.0:
Date: 18/10/2024
- Initial release of the High Momentum Trading framework
- Combined multi-timeframe trend, volume, and momentum analysis.
- Focused on identifying strong trending moves high momentum
HMT v2.0:
Date: 17/12/2024
- Major update to the Momentum indicator
- Reduced false signals from inaccurate momentum detection
- New screener with improved accuracy and fewer signals
HMT v3.0:
Date: 23/12/2024
- Added liquidity factor to enhance trend continuation
- Improved potential for momentum-based plays
- Increased winning probability by reducing entries during peaks
HMT v3.1:
Date: 31/12/2024
- Enhanced entry confirmation for improved reward-to-risk ratios
HMT v4.0:
Date: 05/01/2025
- Incorporated buying and selling pressure in lower timeframes to enhance the probability of trending moves while optimizing entry timing and scaling
HMT v4.1:
Date: 06/01/2025
- Enhanced take-profit (TP) target by incorporating market structure analysis
HMT v5 :
Date: 23/01/2025
- Refined wave analysis for trending conditions
- Incorporated lower timeframe (LTF) momentum to strengthen trend reliability
- Re-aligned and re-balanced entry conditions for improved accuracy
HMT v6 :
Date : 15/02/2025
- Integrated strong accumulation activity into in-depth wave analysis
HMT v7 :
Date : 20/03/2025
- Refined wave analysis along with accumulation and market sentiment
HMT v8 :
Date : 16/04/2025
- Fully restructured strategy logic
HMT v8.1 :
Date : 18/04/2025
- Refined Take Profit (TP) logic to be more conservative for improved win consistency
LMT v1.0 :
Date : 06/06/2025
- Rebranded to emphasize key levels + momentum as the core framework
LMT v2.0
Date: 11/06/2025
- Fully restructured lower timeframe (LTF) momentum logic

WUSDT – Weekly Bullish Divergence | Trendline Break Signals PossWUSDT – Weekly Bullish Divergence | Trendline Break Signals Possible Macro Reversal 🚀📈
Hey traders 👋
After a long stretch of bearish pressure, WUSDT is finally showing its first real signs of strength. On the weekly timeframe, we have a bullish divergence forming — a major clue that selling momentum is drying up and buyers are stepping back in.
On top of that, price has just broken out of the descending trendline that kept it capped for months. This combo of divergence + breakout is exactly what marks the beginning of bigger trend shifts.
📈 Technical Breakdown
Weekly Divergence:
Price kept printing lower lows
RSI made higher lows → classic bullish divergence
Trendline Break: Price finally broke through the descending resistance line
Volume Picking Up: Subtle but noticeable, backing the breakout
This isn’t a scalper’s setup — it’s macro-level price action.
🎯 Trade Plan Idea
Entry Zone: Around the breakout + retest level
Stop-loss: Just under the breakout base
Targets:
TP1: 0.24 (first major resistance)
TP2: 0.41 (swing resistance zone)
TP3: 0.78+ (macro target if momentum continues)
The R:R is massive here — a proper swing idea worth tracking over weeks/months.
📌 WUSDT Showing Weekly Bullish Divergence + Trendline Break – The Bottom May Be In
Would you scale in on dips, or wait for retest confirmation? Drop your strategy 👇
#WUSDT #BullishDivergence #Crypto #SwingTrade #TrendlineBreak #Altcoins #ReversalSetup #TechnicalAnalysis

worm hole worming its way down the hole?looks like we might get thhat bear wave maybe ,,,,, looking for .07727.for smart money grab. not finacial advise, stop loss above the high
worm hole possible bearish wave aheadlooks like wormhole latest pump might be over it hit the trend line and 1,62 could retrce to 0,075 . not financial advice

wormhole possibly bullishmight pump to 20/ 23c. looks like correction just ended good spot to enter a long

WUSDT Forming Falling WedgeWUSDT is currently forming a strong bullish setup as it has developed a classic Falling Wedge pattern, which is historically known as a reversal and continuation pattern. This structure often indicates that selling pressure is weakening while buyers are gradually stepping in with stronger momentum. The breakout potential from this wedge suggests a strong upside opportunity supported by good volume, signaling that market participants are positioning for a possible bullish rally.
With an expected gain of 50% to 60%+, WUSDT is becoming an attractive pick for traders looking for high-reward setups. The increasing trading activity reflects growing confidence among investors, and this could act as a catalyst for significant price movement once the breakout is confirmed. Strong buying volume further validates the possibility of sustained bullish momentum in the near term.
The combination of a falling wedge breakout and rising investor interest creates an ideal scenario for WUSDT to enter its next growth phase. As long as it maintains support levels and continues to attract liquidity, the probability of a sharp upward move remains high. Many traders will be keeping a close eye on this pair, as the current chart setup aligns well with previous successful wedge breakouts seen across the market.
✅ Show your support by hitting the like button and
✅ Leaving a comment below! (What is You opinion about this Coin)
Your feedback and engagement keep me inspired to share more insightful market analysis with you!

Inverted Head & Shoulders · Wormhole TokenI added the little pattern to the picture. Keep in mind that this is a weekly chart. So the pattern looks small but it actually covers a long period of time because of each candle contains 7 days of price action. Weekly.
Head and shoulders. That's the pattern. In this case inverted because the standard pattern is a bearish reversal signal. It tends to show up at the top of a trend. You get the left shoulder (a high/peak) followed by the head (a higher high), then the right shoulder (lower high) and you have your reversal pattern. When the neckline of the pattern breaks comes the crash.
When the patterns shows up at the end of a downtrend it becomes the "inverted head and shoulders (iH&S)" as a bullish reversal signal.
In this chart each point has really high volume. How interesting. And this week is producing the highest volume ever and it is buying and it is green. This is all happening at the bottom.
The left shoulder produced high volume in March/April. Then the head has really high volume in June, and the right shoulder has the highest volume ever now, late August 2025.
The bottom is in now for more than two months. The bottom range has been active for more than five months.
Wormhole Token already hit bottom.
WUSDT is preparing for a massive bullish run. This trading pair can grow for years, the same for many others. Just like many projects did between 2023 and 2024. Remember, the market is big now. Just because one project peaks doesn't mean the entire market is in the same place. They will all peak, but it takes time.
Years of higher highs and higher lows. Your position is safe.
Trust the Master.
Namaste.

WUSDT Bullish Reversal Confirmed?BINANCE:WUSDT has been moving within a descending channel since the start of the year, forming lower highs and lower lows. Recently, the price broke out of the channel resistance, showing strength with increased buying volume. This breakout suggests that bearish momentum is weakening, and a potential bullish reversal could be underway.
Stop loss : $0.070
Target: 100%-250%
Cheers
Hexa

Wormhole $W - decision dailyClose below the cloud = close the position.
I'm currently long so my bias is up but will get out of my position if the daily close is out of the cloud.
