XCN DAILY TIMEFRAME UPDATE (ON DEMAND)❤️ THIS POST AND I WILL SHARE NEXT 10X GEM COIN
Onyx Protocol is a decentralized platform that facilitates a peer-to-peer money market lending protocol
ANY THOUGHTS ON SEED_DONKEYDAN_MARKET_CAP:XCN

XCN Analysis (12H)From the point marked START on the chart, the correction of XCN seems to have begun.
Based on the wave structure, the price now appears to be in a complex ABC. Wave B of B looks like a diametric, and we are currently in the middle of wave F.
Once wave g of this diametric is completed, we can enter

Xcn short to $0.01Just now opened up a short on xcn using my DTT strategy- Direction Target and Timing
Sl: 0.010628
Tp: $0.01
Roughly 2R to play conservative. Today might be more volatile than normal due to monthly close but I think the volatility will favor the bears first. Given the trend is down

Xcn short to $0.010262Just now opened up a short position on xcn. Aiming for $0.10262
Sl: 0.010813
2RR plus if plays out

Xcn long to $0.0114Just now opened a long position on xcn. Aiming for $0.114
Sl: 0.010691
Roughly 2.3RR trade.
Overall market is trending up and xn appears to be correcting on the weekly so market likely trend up on lower tf to facilitate this move

Xcn long to $0.0107423 todayOpened a long a while ago
Sl: 0.010426
Aiming for $0.010723
2RR trade.
Overall market is likely to go lower but its likely to correct back up a bit first based on my analysis

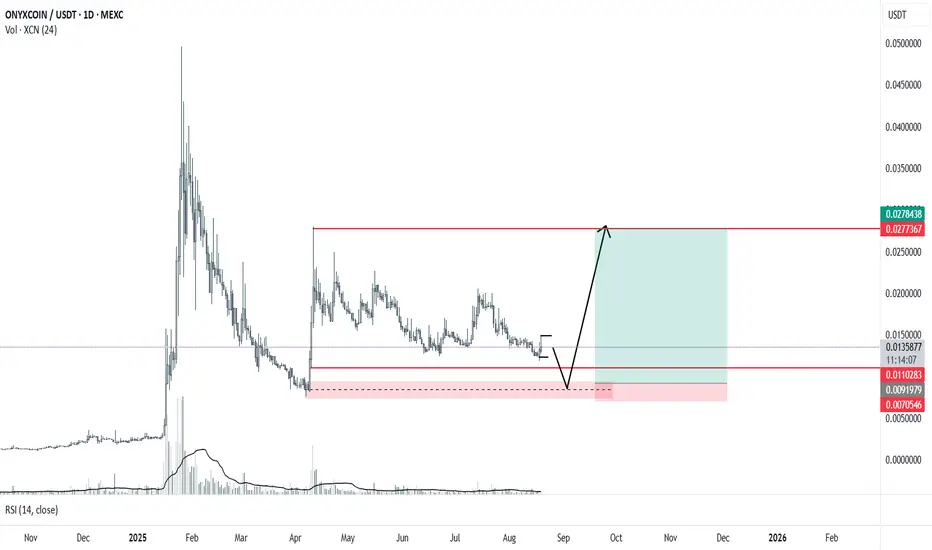
MY prediction on #XCNEvery thing is clear I think price firstly will get the liquidity below the red line then will go up by the red area to the target that marked on chart
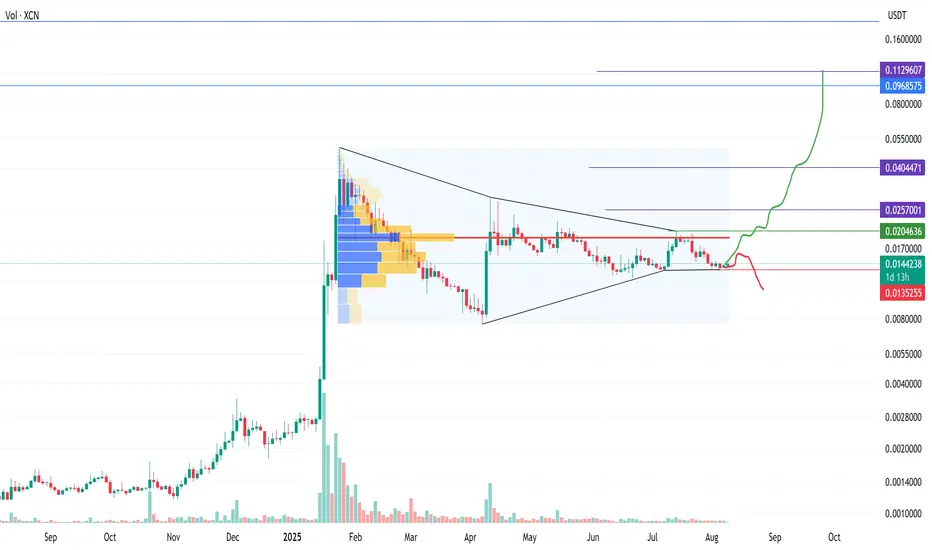
Symmetrical triangle triggered on OnyxcoinThis coin had a 18x pump in Jan 25 and has been forming this pattern for months. It looks like it wants to continue higher. I have entered with spot only, too much volatility for me on this token.
R/R 38 and a Target 0.1128 is a 5x from here.
The pattern has trigged hit interval 1 and returned to

Symmetrical triangle on Onyxcoin setting upXCN had a 18x pump in Jan 25 and has been forming this pattern for months. It looks like it wants to continue higher. I have entered with spot only, too much volatility for me on this token.
R/R 38 and a Target 0.1125 is a 5x from the breakout entry point @ 0.02046.
Entry - 0.02046
Stop - 0.01352
Xcn pump back to $0.01456 area todayJust now opened a long position on xcn. Targetting $0.01456 area. Scaling out
Sl: 0.01394
3-3.56 RR
DTT strategy applied.

See all ideas
Summarizing what the indicators are suggesting.
Oscillators
Neutral
SellBuy
Strong sellStrong buy
Strong sellSellNeutralBuyStrong buy
Oscillators
Neutral
SellBuy
Strong sellStrong buy
Strong sellSellNeutralBuyStrong buy
Summary
Neutral
SellBuy
Strong sellStrong buy
Strong sellSellNeutralBuyStrong buy
Summary
Neutral
SellBuy
Strong sellStrong buy
Strong sellSellNeutralBuyStrong buy
Summary
Neutral
SellBuy
Strong sellStrong buy
Strong sellSellNeutralBuyStrong buy
Moving Averages
Neutral
SellBuy
Strong sellStrong buy
Strong sellSellNeutralBuyStrong buy
Moving Averages
Neutral
SellBuy
Strong sellStrong buy
Strong sellSellNeutralBuyStrong buy
Displays a symbol's price movements over previous years to identify recurring trends.