$1k to $1million with this tiny market cap? - October 2025 As everyone falls off their chair at the prospect of $14k Ethereum.. a messily 220% return (who in crypto gets out of bed for that?), you’ve got to wonder, what percentage of us would lift the bed sheets for Ethereum at $1 as if it were December 2015?
As it turns out, very few.
When I first purchased ADA , MATIC (ideas linked) at 3 and 2 cents, respectively, few were interested. And more recently with XCN . Each of those had a market cap similar in size to the chart above.
Back in those days my specific problem was not finding those opportunities, it was holding onto them. Discovery of a 100x, 500x, or even a 1000x opportunity is not a challenge. Holding on to it is. The up and coming recession, bear market and expected collapse in equities, all of those things are irrelevant when long exposure is taken from such an early stage.
The project is XDB Chain
What’s so special about this low volume nano cap? There’s Fundamentals and Technical analysis.
The XDB chain project is a fork based off the proven Stellar lumens protocol, as it was XRP before it. The project has adopted the core features and capabilities of the latest Stellar network (v19), including the token certification service and on-chain trading (DEX). In their words:
“The platform was created to support the fast and affordable transfer of consumer digital assets such as branded currencies"
There’s plenty of recent rumour etc on social media circles, will let you do your own research.
On the technical analysis
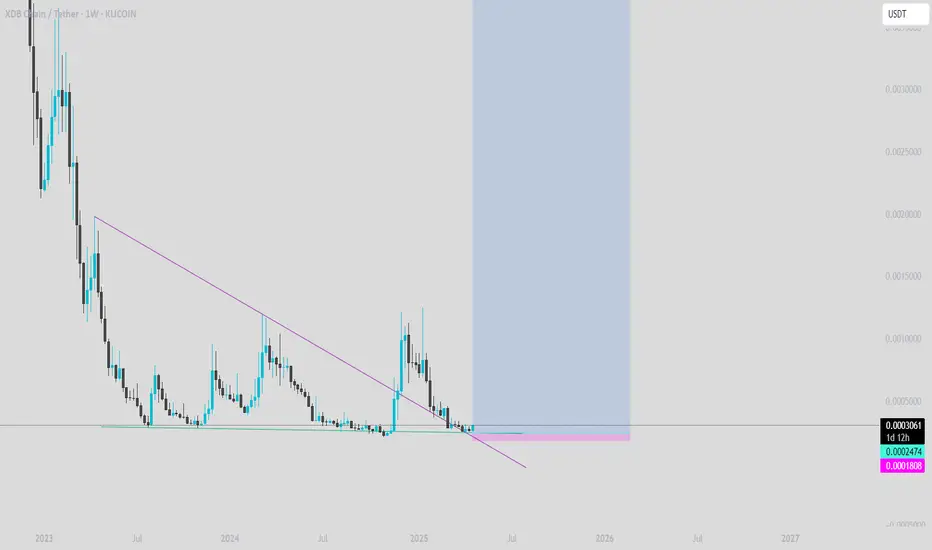
The above weekly chart makes for an interesting study, during the month of November 2024 a development not seen since April 2022 (blue circles) prints. Price enters the Gaussian channel. It was not until this month, October 2025, did the channel change from red to green. This is important. When the colour flips from red to green, it signals that the slope of the Gaussian average has turned positive, or price has crossed above the central line of the Gaussian channel. This is interpreted as an uptrend signal, momentum has shifted from bearish to bullish.
Latterly a 2 year consolidation period now prints an RSI resistance breakout. The first and second resistances are shown at 60x (6000%) and 130x (130,000%).
Conclusions
The chart above represents one of those rare conditions that technical traders wait years to see. A 2 year consolidation, a Gaussian band colour flip, and an RSI breakout from multi-year resistance, these are not everyday occurrences.
Does this guarantee performance? Absolutely not. But when historical patterns align this cleanly, the potential reward to risk ratio becomes exceptional.
If momentum continues and support holds, the projections point toward 60x and 130x levels, equivalent to 6,000% and 130,000% returns respectively. Those numbers sound absurd until you remember: ADA, MATIC, and XCN once sat in similar structures, with low volume, and largely ignored by the market.
Still, as always, holding is the hardest part. A setup like this requires conviction, patience, and most of all, discipline to avoid overexposure.
$1,000 to $1 million sounds incredible, but markets rarely reward impatience. A bullish bias is only valid while structure confirms. Lose that confirmation, and the opportunity resets.
For now, the data speaks for itself:
Gaussian flip (October 2025) : momentum turns bullish
RSI breakout: first in over two years
Price structure: higher low + band confirmation
Is it possible price action continues correcting? For sure, nothing is certain.
Is it probable? No.
Ww
========================
Disclaimer
This analysis is for **educational purposes only** and reflects my personal opinion, not financial advice. Cryptocurrency markets are speculative and volatile; prices can fluctuate rapidly and may result in total loss of capital. Always conduct your own due diligence, understand your risk tolerance, and never trade based on a single analysis or forecast.
Previous low cap ideas:
ADA @ 3 cents in December 2018, 9000% or 90x
MATIC or Polygon @ 2 cents, 13000% or 130x
XCN @ 0.00077 cents, 6600% or 66x
Market insights


New Chart XDB 1WIt may be time to break through the heavy resistance of 0.0012 and exit a boring channel after 3 years. It may be too early to judge, so be prepared for the move and the critical and perhaps good days of the market.

XDB see you @ 0.10$One of the hidden gems. There is a retest of a broken uptrend at 0.10$ .I think when the massive bull run starts XDB is going to melt faces.
Xdb bullishAlts are gaining momentum .
Once everything is settled , we will see the altseason start.
I think xdb at 2 cents is more than doable.
Lets wait for our moment.
Patience .
XDB where next?100x gem .
With a huge potential to the upside .
One of the few that will do such a crazy run.
Get it before it is too late.
Soon it will melt faces.
LONG AND STRONG.
This is just starting.
Lets make it happen.

XDB longNice consolidation at this region.
Soon it will blast to the upside .
January will be glorious.
Lets pump the market altogether.

A promising comebackXDB 1M
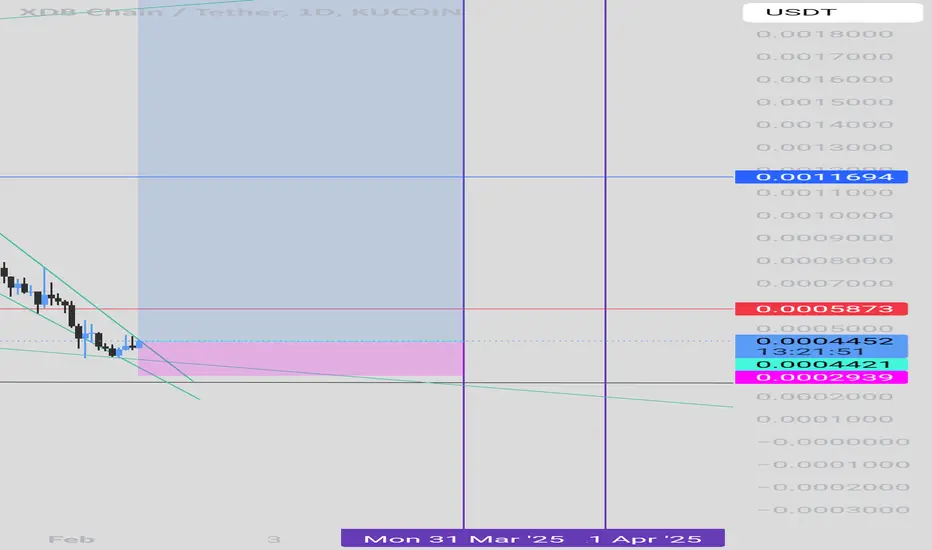
On the monthly time frame, we are witnessing a good reversal pattern for this currency.
As you can see, the static resistance is at 0.0012, as well as the dynamic resistance, the 10-moving average, which is currently at 0.0011669.
Note that the time frame is monthly, and given the one-month stick plan of this currency, there is a higher possibility of an increase.

Xdb best case scenario XDB can go and hit cents , that is a 120x from current price action.
Anything is possible .
During bull run everything pumps.

XDBUSDTAssuming this is the bottom, the chart targets are very clear using the parallel channels. NFA

XDB 1MWill it come ready to fly?
It seems that we are ready for a strong upward movement on the monthly chart. Considering that we are at the bottom of the descending channel and the Adam and Eve pattern is visible, if the market conditions maintain their upward trend, it is possible to reach higher prices.

🍯"Sweet Profits with XDB:Unveiling Opportunities with XDBees"🐝Welcome to The CryptoHoney Kingdom, where we dive deep into the buzzing potential of XDB coin, exploring its nectar-rich opportunities for savvy investors. Just like bees meticulously gather honey, we've gathered data and insights to show why XDB might be the next sweet spot in your investment portfolio.
🐝 What's Buzzing?
Discover the unique features and recent updates of XDB that make it a standout in the crypto landscape. We'll explore its technological advancements, market positioning, and potential for adoption.
🍯 Sweet Spots Identified:
Using detailed charts and analysis, I’ll pinpoint the key entry and exit points, helping you to maximize your trades. Whether you're looking to hold long-term or profit from short-term fluctuations, we've got the insights you need.
🐝 The Hive’s Strategy:
Learn from The CryptoHoney Kingdom’s strategic approach to trading XDB. I’ll share my personal strategies that have consistently yielded profitable returns, complete with risk management techniques to protect your hive’s wealth.
🍯 Join the Swarm:
Engage with a community of like-minded traders in The CryptoHoney Kingdom. Share ideas, and strategies, and grow your crypto knowledge in a supportive environment.
Dive into the sweet, lucrative world of XDB with us and let’s harvest the potential profits together! Follow for more buzzworthy insights and updates from The CryptoHoney Kingdom.

XDB/USDTLong-term, XDB CHAIN can have a big potentian! Right now is very underrated.
What Makes XDB CHAIN Unique?
The project was and remains one of the fastest blockchains in the crypto industry. As a fork of the Stellar (XLM) blockchain, XDB CHAIN supports an enterprise-grade blockchain with a focus on brands and enterprise use.
Potential of 5,000 - 10,000% in the long term.

XDB follow up on Dec 1st postXDB thought process on the daily ( showing bullish divergence ) but nothing else on lower time frame. Made a video ( answering @cryptokws )
I was looking forward to XDB breaking out of the Adam and Eve pattern ( that was posted on Dec 1st 2023 )
This is for ENTERTAINMENT purpose Only.
Not Financial Advise
Always DYOR ( do your own research )

Is XDB ready to fly!?Assuming that we are in the process of a 5-wave upward movement in weekly time, if the correction of wave 2 does not continue further, according to the Fibonacci lines, the targets of wave 3 are almost certain. You can also see that the EMA10 & EMA20 lines are currently acting as support and resistance.

The start of a bullish rally with a golden cross on XDBIn the daily time frame, the Golden Cross has occurred and the SMA50 (yellow line) has crossed the SMA200 (white line) upward, which can promise an upward rally for this currency.
In general, it seems that if the volume increases, the conditions are suitable for price growth.
Note that due to the high risk of the currency, if you buy, make sure to put a stop so that you don't suffer a loss.

XDB: $0.0017 | an under loved issue yet Adored by BIG SHOTSTOKENiZATiON of the world .. and XDB has the infra to make it happen for companies and brands to transition in the blockchain space
think Publicis or Satchi & Satchi BRANDING strategy of Coke Starbuck etc.. only this XDB is the backbone to migrate to the new world
Cap: $5M
Supply: 20bn coins
Float: 15% Regulated
Strategy: dca
Tactic: eye on green VOLUME bar after series of RED bars end on the WEEKLY
Upside: 50x
Bonus: 100x
Sureplay: 10x
Catalyst: BTC breaking Out

XDB Adam & Eve pattern on the daily very nice Adam & Eve pattern on the daily
enter at current price
lower entries 0.0006322 / 0.0005073
target 0.0012590
+60% ! ( and this is just the 1st target )
This is for ENTERTAINMENT purpose Only.
Not Financial Advise
Always DYOR ( do your own research )

XDB Accumulation - with XDB/BTC pairing.Accumulating XDB and running it in XDB/BTC pairing bots.. It is my coin for the year that may turn around and is finding it's bottom, if it hasnt already done so.
Current info
- XDB is an active project with updates informed vua Twitter and Medium
- It is a payment system that offers 10-15% in rewards after its used for a purchase at this time.
- They just launched payments in ASRoma, Doppleganger and Nuvolari (50 or so) stores. according the their Twitter handle Digitalbitsorg.
- In ... I believe MEXC AMA, they teased a large 900+ location brand chain that they are working with to launch Digibits for payments and rewards.
- Uses AtraX wallet
- It was primarily traded on Kucoin and Gate.io, but in the past month or two it has been listed on MEXC, CoinDCX, BTCEX, Deepcoin, etc.
- Also according to their Twitter, "#Defi is coming. AMM and liquidity pools are part of the V18 update, which is in testnet."
- Tokenomics roughly 3b/20b circulting. Some have been burned, some donated to Ukraine (address untouched since donation as of now).
- A token release/minting schedule is unknown.
I've been accumulating for a month or two.It has an ATH of 0.84 and is currently trading at ~0.00138. I'll be accumulating 0.0002-0.006. It's All time low is 0.00113147 on Kucoin. Which is down 99.xx%. Given the project being active, payments/rewrds available in a growing list of new stores, and DEFI in testnet the project appears to be undervalued. Weekly volume since October 2022-current is roughly 50x when copared to 2021 when it had it's high of 0.84 which is good news, but the Tokenomics needs to be monitored.

After a long time, a bearish structural change happened for the DigitalBits has managed to close a candle above 0.0006505 in the daily time frame and in practice it can be said that by breaking the ceiling that the new floor had created, a change in the bearish structure has happened for this currency after a long time.
Our bullish scenario is still running and the price targets at this stage of the rise are marked on the chart.
This analysis is a personal opinion, please do not use it as the basis of your purchase and sale without further research.

XDB (DigitalBits) 5 rising wavesIf XDB (DigitalBits) wants to climb with 5 waves, such a pattern can be imagined based on Elliott waves and the target 0.0015 can be considered. The important point for researching this issue is to cross 0.0006505 because this is the ceiling price that created a new floor, and by crossing this price, its long-term bearish structure will change.
This analysis is a personal opinion, please do not use it as a basis for trading without doing your own research. Please share your opinion with me.


Important price area for a bearish structural changeIn order to increase the price more, it is necessary to change the downward structure, which has occurred with each price increase, a further decrease in price, so the price increase has been a selling opportunity until now. Therefore, the long-term bearish structure should change with a valid break above 0.00065050, which is the previous price ceiling. This area is very important to change the trend.
