Scalp Short – XEC📉 Scalp Short – XEC
RSI previously reached extreme overbought levels. Price attempted to retest the previous high but failed, showing weakening bullish momentum. Selling pressure is increasing, suggesting a likely correction ahead — a short setup worth testing.
🎯 Trade Setup:
Take Profit (TP): 0.00001346
Stop Loss (SL): 0.00001517
Risk/Reward Ratio (RR): 1 : 2.42
A precise short setup supported by failed retest behavior and rising selling momentum, signaling potential downside continuation.
Market insights

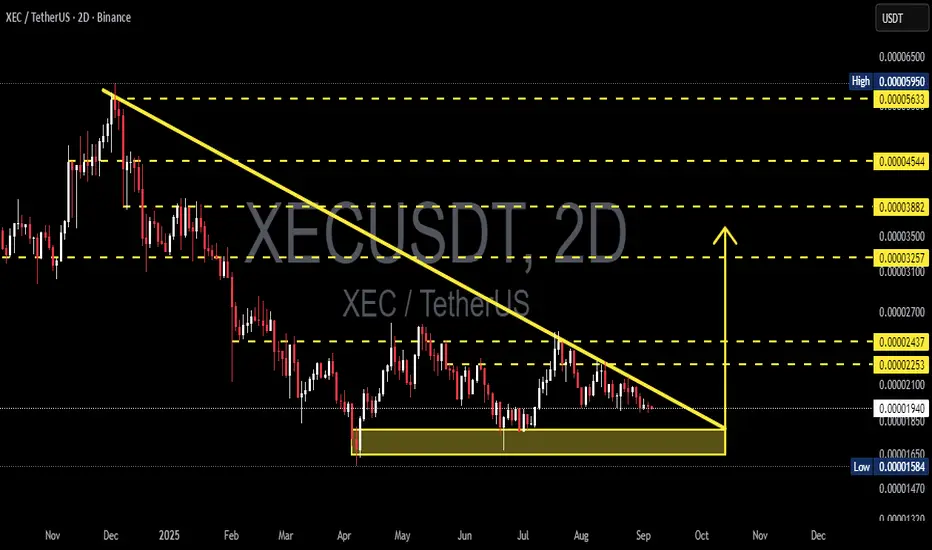
XEC/USDT — Descending Triangle: Breakout Toward or Breakdown?XEC/USDT is currently moving in a critical consolidation phase after a prolonged downtrend since early 2025. On the 2D timeframe, the chart clearly forms a descending triangle, with a consistent downtrend line pressing the price lower, while buyers are still defending a strong support zone at the bottom.
---
🔎 Technical Overview
Main Pattern: Descending Triangle (statistically bearish continuation, but direction requires confirmation).
Key Support Zone (yellow box): 0.00001584 – 0.00001850 → tested multiple times as buyers’ defense.
Downtrend Line: Pressuring price since early 2025, showing persistent selling pressure.
Current Price: around 0.00001940.
First Resistance Zone: 0.00002253 – 0.00002437 (critical breakout area).
Higher Resistances: 0.00003257, 0.00003882, 0.00004544, up to 0.00005633.
---
🟢 Bullish Scenario
If the price breaks above the downtrend line and closes above 0.00002253–0.00002437 with strong volume, the descending triangle may fail as a bearish setup and instead flip into a bullish reversal signal.
Measured Move Target: ~0.00003106.
Next Resistance Targets: 0.00003257, 0.00003882, and 0.00004544.
Upside Potential: +60% to +120% from current levels if momentum follows through.
Retest of the broken trendline as new support would add extra confirmation.
---
🔴 Bearish Scenario
If price fails to hold and closes below 0.00001584 on the 2D chart with strong volume, the descending triangle confirms its bearish continuation pattern.
Downside Target (measured move): ~0.00000730.
Downside Risk: More than -60% from current price levels.
After breakdown, a small pullback to retest the old support as resistance is highly possible before further decline.
---
📌 Key Notes
Volume is crucial: A breakout/breakdown without significant volume risks becoming a false move.
Confirm via 2D close: Intraday wicks can be misleading; use 2D candle close for validation.
Risk management:
For bullish setups → stop-loss below support zone.
For bearish setups → stop-loss above retest zone.
Market context: Altcoins like XEC are highly influenced by BTC’s dominance and overall crypto liquidity — always check the bigger picture.
---
📝 Conclusion
XEC is now at a make-or-break level. The descending triangle could resolve into two extremes: a bullish reversal breakout toward 0.000031–0.000038, or a bearish breakdown toward ~0.000007.
As long as price trades inside the triangle, the best approach is to wait for breakout or breakdown confirmation before taking major positions. Aggressive traders may prepare for breakout + retest entries, while long-term investors might see this support zone as an accumulation range — but with strict risk management.
---
#XEC #XECUSDT #CryptoAnalysis #TradingView #Altcoin #ChartPattern #DescendingTriangle #BreakoutTrading #CryptoStrategy
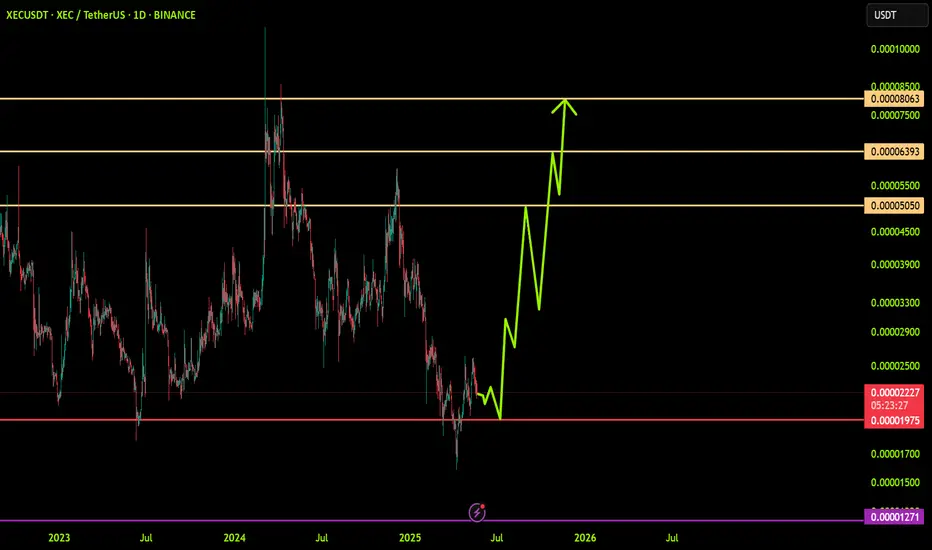
XECUSDT Forming Bullish WaveXECUSDT is displaying a strong bullish wave pattern, suggesting a potential continuation of its current uptrend. The structure reflects a healthy impulse wave formation, often indicative of early stages in a major bullish cycle. Price action has consistently respected key support zones while printing higher highs and higher lows—a classic sign of market strength. With volume backing this movement, investor sentiment appears increasingly positive as XEC begins gaining traction among altcoin watchers.
Technically, the asset has broken out from its consolidation phase and now targets the next resistance zones that could unlock a 50% to 60% price increase. This wave pattern is particularly compelling for swing traders and position traders, as the setup offers clear entry points and a strong risk-to-reward ratio. Volume surges during bullish candles confirm the accumulation phase is over, and momentum is building for a sustained leg up.
Fundamentally, XEC (eCash) continues to strengthen its ecosystem, focusing on fast, low-fee payments that appeal to real-world adoption. Its consistent development updates and community support are bringing more visibility to the project. As blockchain adoption grows globally, eCash's utility as a digital currency is becoming more relevant—attracting both retail and institutional interest.
This is a critical moment for XECUSDT, and traders watching this bullish wave structure could be early in capturing significant upside potential. If momentum continues and broader crypto sentiment remains favorable, the 50% to 60% target range appears well within reach in the near term.
✅ Show your support by hitting the like button and
✅ Leaving a comment below! (What is You opinion about this Coin)
Your feedback and engagement keep me inspired to share more insightful market analysis with you!

XECUSDT UPDATE
Pattern: Falling Wedge Breakout
Current Price: \$0.00001929
Target Price: \$0.00004752
Target % Gain: 135.64%
Technical Analysis: XEC has broken out of a long-term falling wedge pattern on the 1D chart. Breakout is supported by a clear wedge structure and bullish momentum. A sustained move above the trendline confirms the potential upside.
Time Frame: 1D

XECUSDT: Trend in daily timeframeThe color levels are very accurate levels of support and resistance in different time frames, and we have to wait for their reaction in these areas.
So, Please pay special attention to the very accurate trend, colored levels, and you must know that SETUP is very sensitive.
Be careful
BEST
MT
XEC/USDT – Coiled for One of Those MovesThere aren’t many charts out there right now that feel like this one. But XEC is different. This one has that look — like it’s ready for one of those wild crypto moves that leave people staring at the chart in disbelief after the fact.
I’m keeping it simple:
The blue box is the only place I want to be a buyer.
It’s sitting right below a recent range where liquidity is likely stacked, and the reaction from this zone could be violent. These are the setups that come quietly — low-key, ignored by the crowd — and then suddenly take off.
No new highs, no aggressive push yet… but everything about this structure says coiling pressure. If we dip into that zone, I’ll be watching closely for a volume shift, order flow reversal, or even a CDV divergence to confirm.
This isn’t about predicting. It’s about preparing.
And if XEC plays out the way I’ve seen similar patterns behave before... you’re going to want to be early, not late.
“I will not insist on my short idea. If the levels suddenly break upwards and do not give a downward break in the low time frame, I will not evaluate it. If they break upwards with volume and give a retest, I will look long.”
The setup is clean. The risk is defined. And the upside? Let’s just say it’s the kind of chart that doesn’t move often, but when it does, it doesn’t ask permission.
🧠 Ignore it if you want, but if this launches and you were waiting for the perfect confirmation… you’ll wish you acted sooner.
Let’s see if price gifts us that dip into the blue zone. If it does — I’ll be there.
📌I keep my charts clean and simple because I believe clarity leads to better decisions.
📌My approach is built on years of experience and a solid track record. I don’t claim to know it all but I’m confident in my ability to spot high-probability setups.
📌If you would like to learn how to use the heatmap, cumulative volume delta and volume footprint techniques that I use below to determine very accurate demand regions, you can send me a private message. I help anyone who wants it completely free of charge.
🔑I have a long list of my proven technique below:
🎯 ZENUSDT.P: Patience & Profitability | %230 Reaction from the Sniper Entry
🐶 DOGEUSDT.P: Next Move
🎨 RENDERUSDT.P: Opportunity of the Month
💎 ETHUSDT.P: Where to Retrace
🟢 BNBUSDT.P: Potential Surge
📊 BTC Dominance: Reaction Zone
🌊 WAVESUSDT.P: Demand Zone Potential
🟣 UNIUSDT.P: Long-Term Trade
🔵 XRPUSDT.P: Entry Zones
🔗 LINKUSDT.P: Follow The River
📈 BTCUSDT.P: Two Key Demand Zones
🟩 POLUSDT: Bullish Momentum
🌟 PENDLEUSDT.P: Where Opportunity Meets Precision
🔥 BTCUSDT.P: Liquidation of Highly Leveraged Longs
🌊 SOLUSDT.P: SOL's Dip - Your Opportunity
🐸 1000PEPEUSDT.P: Prime Bounce Zone Unlocked
🚀 ETHUSDT.P: Set to Explode - Don't Miss This Game Changer
🤖 IQUSDT: Smart Plan
⚡️ PONDUSDT: A Trade Not Taken Is Better Than a Losing One
💼 STMXUSDT: 2 Buying Areas
🐢 TURBOUSDT: Buy Zones and Buyer Presence
🌍 ICPUSDT.P: Massive Upside Potential | Check the Trade Update For Seeing Results
🟠 IDEXUSDT: Spot Buy Area | %26 Profit if You Trade with MSB
📌 USUALUSDT: Buyers Are Active + %70 Profit in Total
🌟 FORTHUSDT: Sniper Entry +%26 Reaction
🐳 QKCUSDT: Sniper Entry +%57 Reaction
📊 BTC.D: Retest of Key Area Highly Likely
📊 XNOUSDT %80 Reaction with a Simple Blue Box!
📊 BELUSDT Amazing %120 Reaction!
📊 Simple Red Box, Extraordinary Results
I stopped adding to the list because it's kinda tiring to add 5-10 charts in every move but you can check my profile and see that it goes on..

XEC Downtrend Update
After the ABC correction shown in my previous analysis, we have a motive wave to the downside.
I´m considering wave 1 to be an extended wave. Therefore, by EW parameters, we would have wave 3 shorter than 1, and wave 5 shorter than 3.
Blue resistance is an probable target for wave 4.

E cashthe network that will soon replace bitcoin, note what I tell you, you will see it for yourself very soon.
This is not a financial advice dyorr
Enjoyyy
It's time for me to leave you, delighted to have seen you evolve
Kind regards
Boss

XECUSDT 1WXEC ~ 1W Analysis
#XEC This is the lowest support for now. Buy gradually from here if you still have a Conviction on this Coin with a minimum target of 20%+.

XECUSDTRisk warning, disclaimer: the above is a personal market judgment based on published information and historical chart data on Tradingview, all analysis is only subjective. Hope investors consider, that I am not responsible for your investment decision.
Thank you.
Good luck

XecStrong support here. Reversal look good now
Time to up !
Enjoyyy
This is not a financial advice dyorr
Enjoyyy

XECUSDT 1WXEC ~ 1W
#XEC If you still have Conviction on this coin,. This support block would be a very good buying place for now,. With a minimum target of 20%++

#XEC (SPOT) IN( .000030- .000036)-T (.000180) - SL (.00002963)BINANCE:XECUSDT
#XEC / USDT
Entry ( .000030- .000036)
SL 1D close below .00002963
T1 0.000051
T2 0.000069
T3 0.000100
T4 0.000140
T5 0.000180
______________________________________________________________
Golden Advices.
********************
* collect the coin slowly in the entry range.
* Please calculate your losses before the entry.
* Do not enter any trade you find it not suitable for you.
* No FOMO - No Rush , it is a long journey.
Useful Tags.
****************
My total posts
www.tradingview.com
1Million Journey
www.tradingview.com
www.tradingview.com
**********************************************************************************************
#Manta #OMNI #DYM #AI #IO #XAI #ACE #NFP #RAD #WLD #ORDI #BLUR #SUI #VOXEL #AEVO #VITE #APE #RDNT #FLUX #NMR #VANRY #TRB #HBAR #DGB #XEC #ERN #ALT #IO #ACA #HIVE #ASTR #ARDR #PIXEL #LTO #AERGO #SCRT #ATA #HOOK #FLOW #KSM #HFT #MINA #DATA #SC #JOE #RDNT #IQ #CFX #BICO #CTSI #KMD #FXS #DEGO #FORTH #AST #PORTAL #CYBER #RIF #ENJ #ZIL #APT #GALA #STEEM #ONE #LINK #NTRN #COTI #RENDER #ICX #IMX #ALICE #PYR #PORTAL #GRT #GMT #IDEX #NEAR #ICP #ETH #QTUM #VET #QNT #API3 #BURGER #MOVR #SKL #BAND #ETHFI #SAND #IOTX #T #GTC #PDA #GMX #REZ #DUSK #BNX #SPELL #POWR

XECUSDT Update 1WXEC Update ~ 1W
#XEC We got a very good entry on this support block,. and the price takes our Limit order. Minimum 20%+ target Take profit gradually.

XECUSDT Daily journey to up 0.00015$$$ ticket
18/12/2024
before summer
xec chart key levels of support and resistance if explosion resistance be come play


XEC to 0.0001XXX after breaking the 0.00005 resistance Don't miss that breakout which about to happened sooner than later
Long and Chill
follow for more to come

SPOT XEC LONG 3.12.2024🎯Purpose:
0.0000636
‼️We enter at 0.5% of the allocated money for spot trading.

SPOT XEC LONG 2.12.2024🎯Purpose:
0.0000602
‼️We enter at 0.5% of the allocated money for spot trading.

XEC Waiting for Correction
Even though the overall bias is bullish, price in the daily chart is in overextended RSI conditions and beginning to show bearish divergence.
Next major resistance is the green zone around 0.00006.
Major support is the gray zone just above 0.00004.
I will be watching for pullbacks to enter long trades targeting the green resistance.

xecusdtThis is my view on xec a potential 19000 percent increase for this alt bull run, what do you think?

SPOT XEC LONG 28.11.2024🎯Purpose:
0,00007776
‼️We enter at 0.5% of the allocated money for spot trading.

Xec !!!!!!Halving is finally on !!!!!!!!! Huuuuge
Buyyy to 1$
This is not an financial advice dyorrr
Enjoyyyy
