Nat gas impulse waveNat gas after finishing the WXY correction week cicle ends wave 2 correction.
correction final in 62% all movement and also reacting in a pivot level for the months demand zone. Also we close to winter in USA .
Start now the big 3 wave !!!!

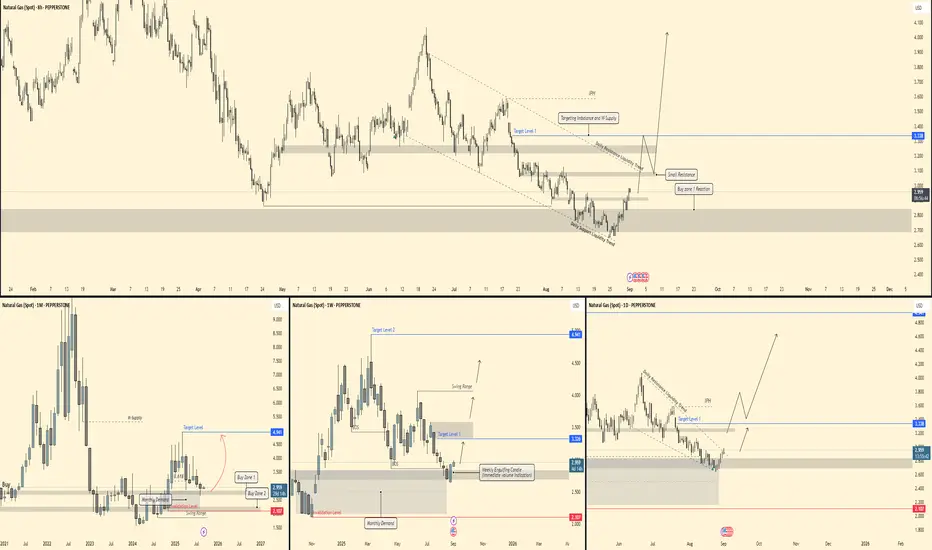
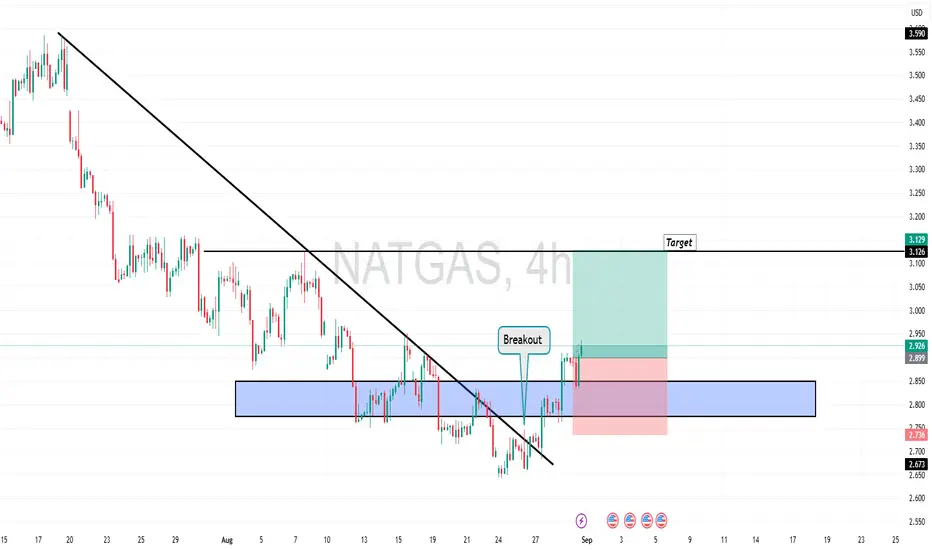
NATGAS - Targets acquired! Bullish Breakout! 📊 NATGAS – Multi-Timeframe Outlook
🔎 Monthly (1M)
Price has respected the monthly demand zone (2.1 – 2.3) with a strong reaction.
Structure still inside a wide swing range, but higher timeframe bias is shifting bullish.
Long-term upside targets sit around 4.9+, aligning with the top of the range
XNGUSD ShortXNGUSD is expected to drop from 3.31 USD, confirmed by a Crab harmonic pattern indicating strong bearish momentum, with TP1 and TP2 as key targets.

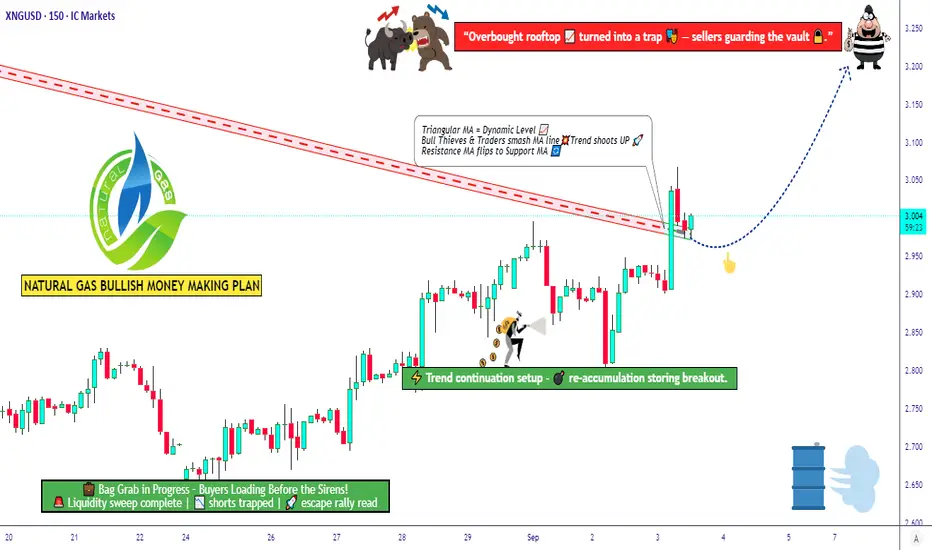
Natural Gas Market Outlook ‖ Bullish Breakout with Risk Control💎 XNG/USD Natural Gas – Thief Trader’s Money Loot Plan (Swing/Scalping) 💎
🎯 Trade Plan (Bullish Setup)
Strategy: Bullish triangular moving average breakout, aligned with Fibonacci 0.382 level.
Entry (Layered Style): Using multiple limit orders (Thief layering strategy). Example entries:
$2.900
$2.95
NatGas Nears the End of Its DiagonalNatural Gas appears to be in the final stages of a large ending diagonal pattern.
Wave (4) can be complete. However, judging by the supply zones and moving averages, we can expect one more leg up before the final decline begins.

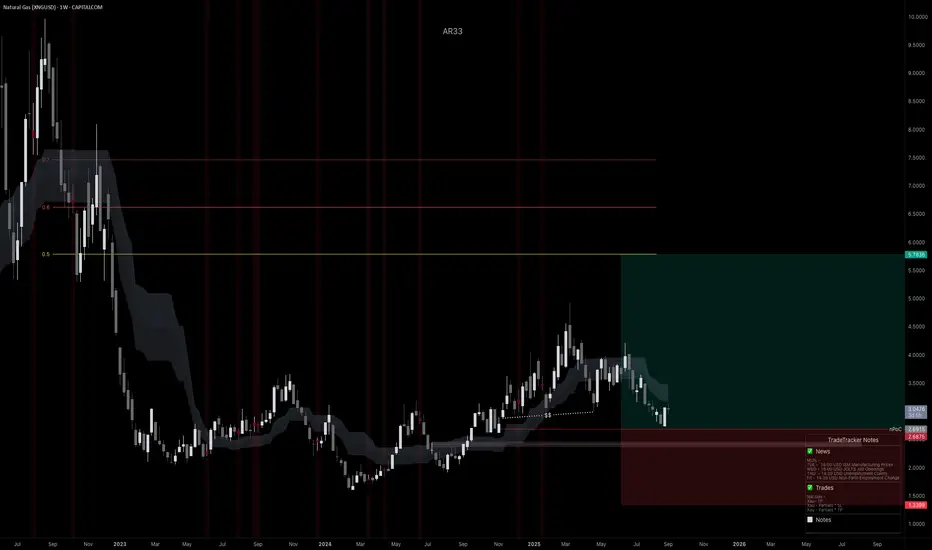
XNGUSD, Accumulation to Expansion? Weekly Long Into Winter RiskI’ve initiated a long on Natural Gas from weekly structure. Price has rotated inside this area since ’23 and is now reacting at a confluence of trendline support + prior demand. The plan is to hold into Q4, when seasonality (heating demand + potential hurricane/LNG disruptions) often provides upside

Natural Gas is in the Buying DirectionHello Traders
In This Chart NATGAS HOURLY Forex Forecast By FOREX PLANET
today NATGAS analysis 👆
🟢This Chart includes_ (NATGAS market update)
🟢What is The Next Opportunity on NATGAS Market
🟢how to Enter to the Valid Entry With Assurance Profit
This CHART is For Trader's that Want to Improve Their Te
U.S. Natural Gas Face Supply Pressures Amid Global ShiftsU.S. Natural Gas Face Supply Pressures Amid Global Shifts
U.S. natural gas futures climbed above $3 per MMBtu in early September, rebounding from a nine-month low of $2.73 on August 20 as expectations of lower domestic supply gained traction.
Fresh data revealed that Russian LNG exports fell over 6

Natural Gas Surging into Key Moving AverageNatural gas has tagged near term resistance.
We have trimmed and locked in profits on many of the equity trades and the boil trade that we were long.
The entire commodity complex minus oil has been very strong.
Inventory report is tomorrow at 10:30am.
Let see if Nat gas can continue its bull

See all ideas
Displays a symbol's price movements over previous years to identify recurring trends.