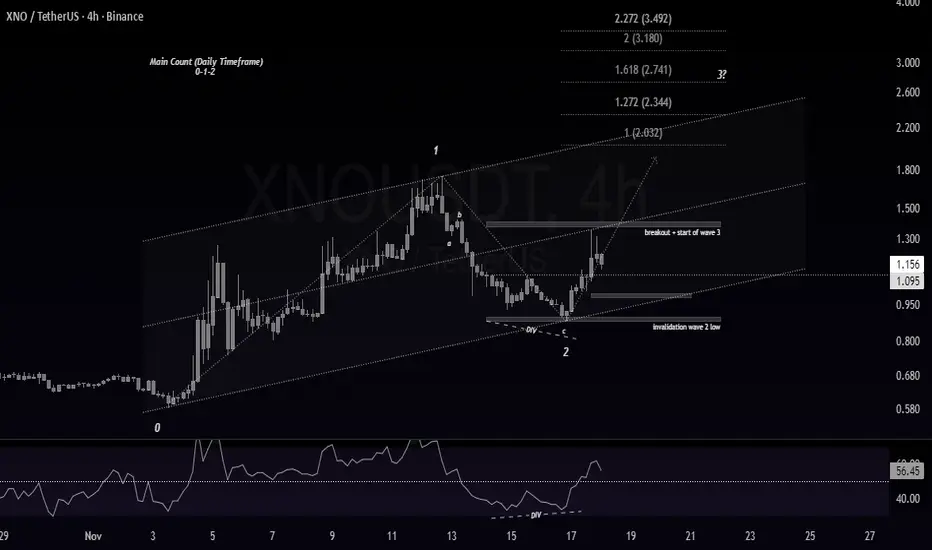
XNO - wavesBINANCE:XNOUSDT
Wave 2 looks complete, and the recent breakout suggests the early development of wave 3.
As long as price holds above the recent low, the bullish setup remains valid.
=This is not financial advice.

XNO MAY OUTPERFORM MARKETXNO Technicals look very bullish and it may outperform market. Use Proper Risk Management

XNO – Wave 3 Structure Building UpBINANCE:XNOUSDT
XNO is forming a clean Elliott Wave structure at the moment.
The main wave count is taken from the daily timeframe, where Wave 1 and Wave 2 are already established.
On the 4H chart, Wave 2 ended with a clear bullish RSI divergence, and price respected the support zone perfectly.
let think not shower take a stratiest 2 shot list
higher high make
rsi d clear
ascending channel.
flag

XNOUSDT Forming Falling WedgeXNOUSDT is currently forming a falling wedge pattern, a powerful bullish setup that often signals the end of a downtrend and the beginning of a strong upward move. The price action shows a narrowing range with lower highs and lower lows, reflecting a period of consolidation before a potential breako
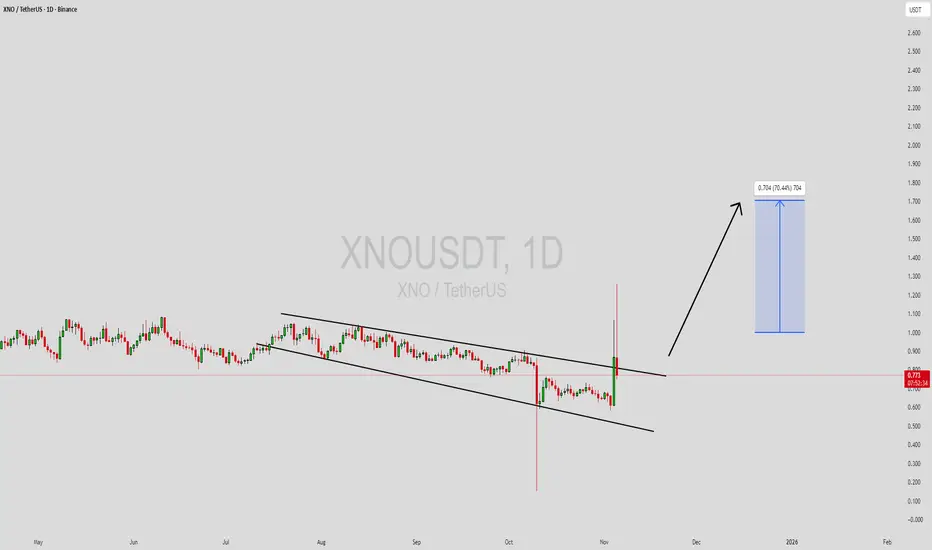
XNOUSDT UPDATE#XNO
UPDATE
XNOUSDT Technical Setup
Pattern: Falling Wedge Breakout
Current Price: $0.809
Target Price: $1.995
Target % Gain: 130.56%
Technical Analysis: XNO has broken out of a falling wedge pattern on the 1D chart, indicating strong bullish momentum. Volume is picking up, and the price has su

XNOUSDT - BOUGHT THE DIP, SOLD THE TOP, NOW WHAT ?What we have done before in XNO is already history, first of all, we gave an 80% rise () and then a 40% fall () with incredible accuracy.
Now when I look at the price, I see neither an increase nor a decrease. Yes, the last increase was sold, but not with high volume, and right now there is selling

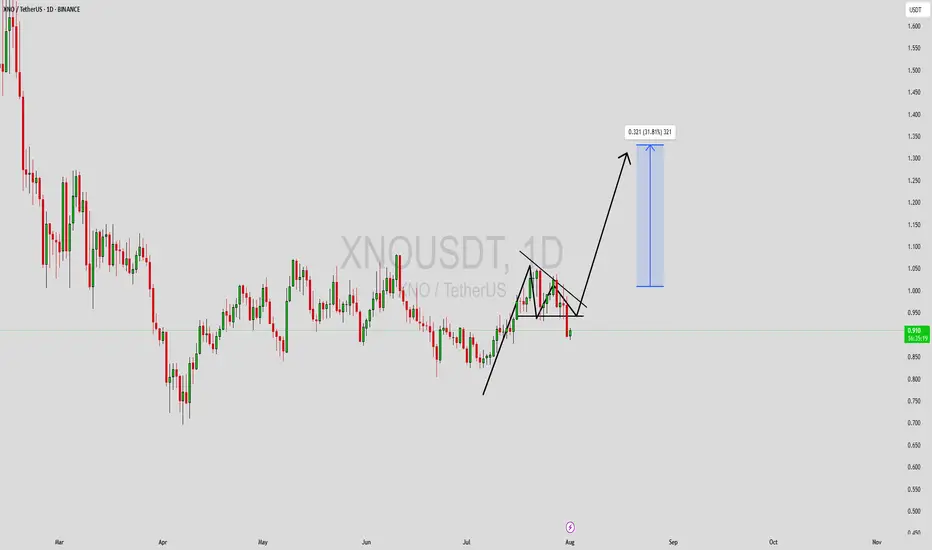
XNOUSDT Forming Bullish PennantXNOUSDT is currently displaying a bullish pennant pattern on the charts, which typically signals a continuation of the prior upward trend after a brief consolidation. This formation is marked by converging trendlines and reduced volatility, often setting the stage for a sharp breakout to the upside.
XNO/NANO copying XRP price actionXNO looks like its almost copying XRPs bear market phase (blue chart is XRP). That means its time to accumulate XNO. It will likely take a few months to hold it until we see bull run which can take it towards previous bull run highs of 17$ or higher.

Those who like squeezing in the era of the dollar collapseEveryone’s eye to BTC, waiting for the next breakout... but something interesting is under the surface.
XNO NANO is one of the coins who under the radar by most people and could have the biggest HYPE and FOMO, but for most of the people, it will be too late ,
quietly getting squeezed. Supply is d
See all ideas
Summarizing what the indicators are suggesting.
Oscillators
Neutral
SellBuy
Strong sellStrong buy
Strong sellSellNeutralBuyStrong buy
Oscillators
Neutral
SellBuy
Strong sellStrong buy
Strong sellSellNeutralBuyStrong buy
Summary
Neutral
SellBuy
Strong sellStrong buy
Strong sellSellNeutralBuyStrong buy
Summary
Neutral
SellBuy
Strong sellStrong buy
Strong sellSellNeutralBuyStrong buy
Summary
Neutral
SellBuy
Strong sellStrong buy
Strong sellSellNeutralBuyStrong buy
Moving Averages
Neutral
SellBuy
Strong sellStrong buy
Strong sellSellNeutralBuyStrong buy
Moving Averages
Neutral
SellBuy
Strong sellStrong buy
Strong sellSellNeutralBuyStrong buy
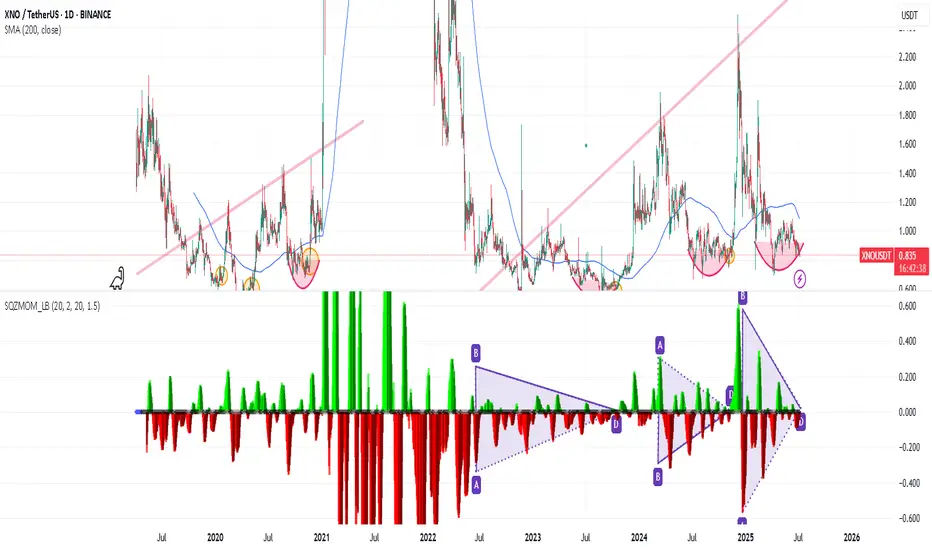
Displays a symbol's price movements over previous years to identify recurring trends.