XNO - wavesBINANCE:XNOUSDT
Wave 2 looks complete, and the recent breakout suggests the early development of wave 3.
As long as price holds above the recent low, the bullish setup remains valid.
=This is not financial advice.
Trade ideas

XNO MAY OUTPERFORM MARKETXNO Technicals look very bullish and it may outperform market. Use Proper Risk Management

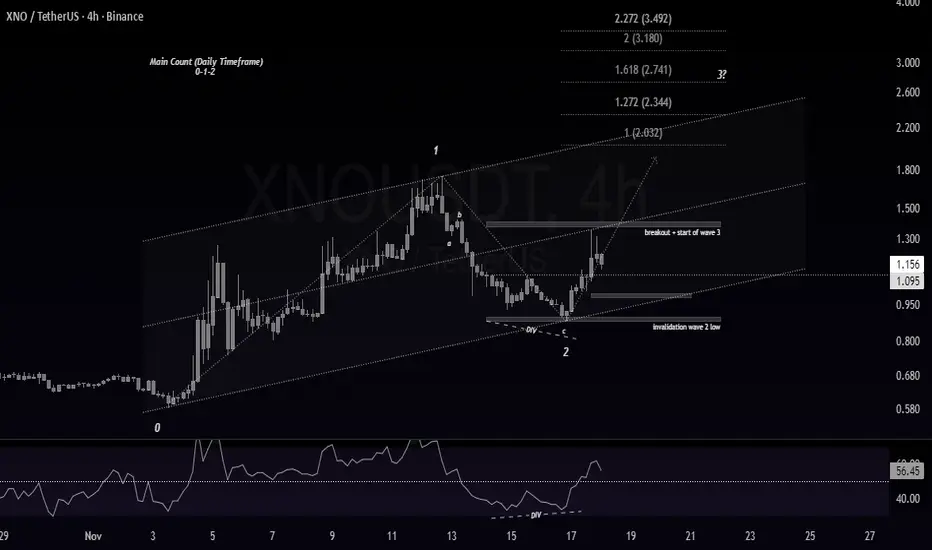
XNO – Wave 3 Structure Building UpBINANCE:XNOUSDT
XNO is forming a clean Elliott Wave structure at the moment.
The main wave count is taken from the daily timeframe, where Wave 1 and Wave 2 are already established.
On the 4H chart, Wave 2 ended with a clear bullish RSI divergence, and price respected the support zone perfectly.
The break above the internal “b-wave” high confirms the early development of Wave 3.
As long as price holds above the Wave-2 low, the bullish setup remains valid.
I’ll update Wave 3 targets as Wave i unfolds and provides clearer levels.
This is a personal wave count, not financial advice.
let think not shower take a stratiest 2 shot list
higher high make
rsi d clear
ascending channel.
flag

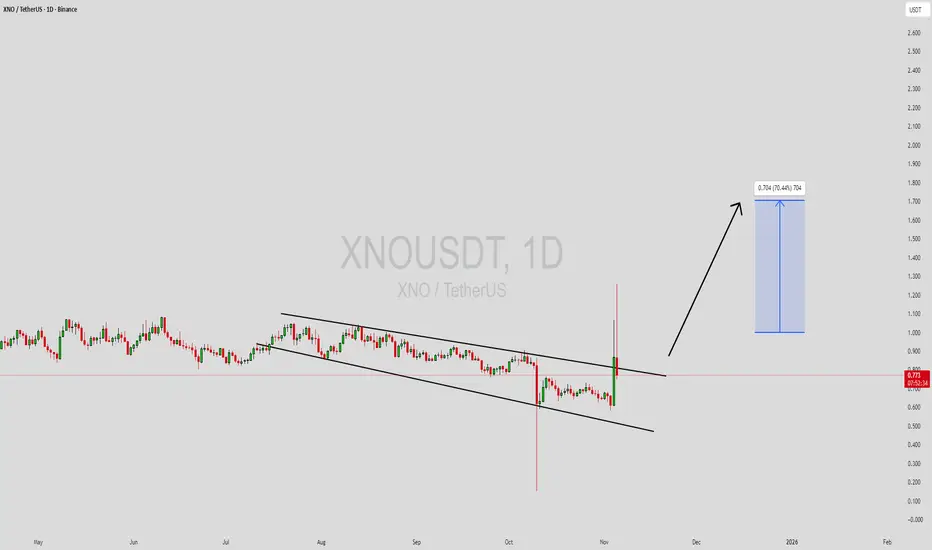
XNOUSDT Forming Falling WedgeXNOUSDT is currently forming a falling wedge pattern, a powerful bullish setup that often signals the end of a downtrend and the beginning of a strong upward move. The price action shows a narrowing range with lower highs and lower lows, reflecting a period of consolidation before a potential breakout. The pattern, combined with good trading volume, indicates that buying pressure is gradually increasing, and a breakout to the upside could soon trigger a 60% to 70% rally from current levels.
This formation suggests that bearish momentum is weakening while smart money accumulation is taking place. Traders are watching closely as the price approaches the wedge’s resistance line, where a confirmed breakout could invite more investors to join the move. The volume behavior supports this bullish outlook, with steady participation showing that market confidence in XNOUSDT is building.
Investors are becoming increasingly optimistic about this project due to its solid fundamentals and technical positioning. The potential for a bullish reversal has attracted significant attention across trading communities, with many anticipating a breakout-driven surge. If momentum continues to strengthen, XNOUSDT could enter a new uptrend phase, delivering impressive short- to mid-term gains.
✅ Show your support by hitting the like button and
✅ Leaving a comment below! (What is You opinion about this Coin)
Your feedback and engagement keep me inspired to share more insightful market analysis with you!
XNOUSDT UPDATE#XNO
UPDATE
XNOUSDT Technical Setup
Pattern: Falling Wedge Breakout
Current Price: $0.809
Target Price: $1.995
Target % Gain: 130.56%
Technical Analysis: XNO has broken out of a falling wedge pattern on the 1D chart, indicating strong bullish momentum. Volume is picking up, and the price has surged above key resistance levels, confirming the breakout.
Time Frame: 1D
Risk Management Tip: Always use proper risk management.

XNOUSDT - BOUGHT THE DIP, SOLD THE TOP, NOW WHAT ?What we have done before in XNO is already history, first of all, we gave an 80% rise () and then a 40% fall () with incredible accuracy.
Now when I look at the price, I see neither an increase nor a decrease. Yes, the last increase was sold, but not with high volume, and right now there is selling pressure, yes, but not with high volume. I think it is right to wait until the price decides on the direction. It is useful to say that the price gives upward signals even if it does not have a full trend. A selling climax passing with low volume is most likely bullish. That's why I'm approaching bullish and I think long opportunities can be evaluated on 4h upward breakouts. However, although it's too early to say anything about giving a spot entry, I don't think it's wrong to alert the blue box and look for a breakout in the low time frame.

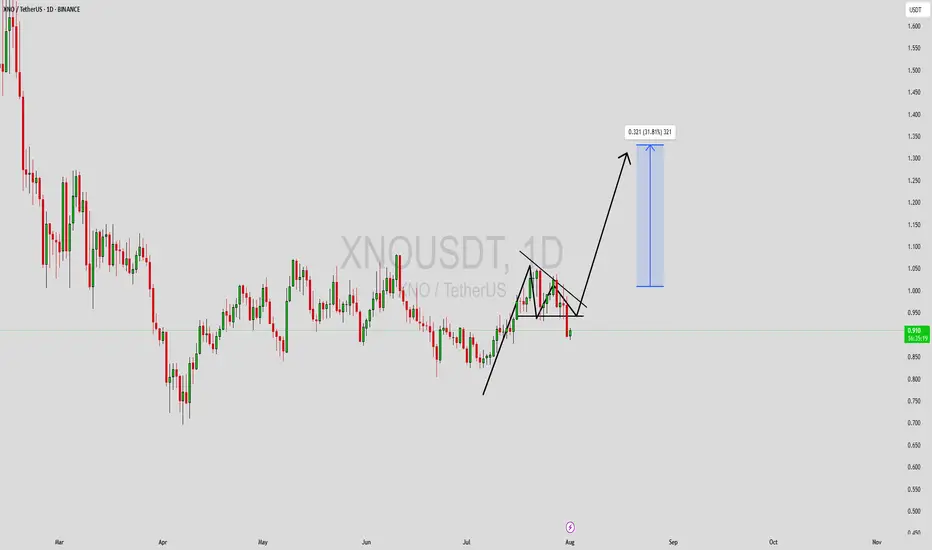
XNOUSDT Forming Bullish PennantXNOUSDT is currently displaying a bullish pennant pattern on the charts, which typically signals a continuation of the prior upward trend after a brief consolidation. This formation is marked by converging trendlines and reduced volatility, often setting the stage for a sharp breakout to the upside. With bullish momentum already in place, traders are closely monitoring this setup for confirmation of the next leg up.
The trading volume remains supportive, maintaining a steady flow that could power a breakout beyond the pennant resistance line. A breakout with a strong volume spike would indicate renewed buying pressure, which could push prices up by 20% to 30% or more. This makes XNO an attractive short-term opportunity for technical traders looking to capitalize on momentum-driven setups.
Investor interest around XNO has been gaining traction, especially as smaller altcoins with solid patterns begin to outperform during market recoveries. The bullish pennant adds to the credibility of this setup, especially in combination with favorable sentiment and increased watchlist mentions across trading communities.
Given the structure and volume dynamics in play, XNOUSDT is positioned for a potential bullish surge if key resistance levels are breached. This pattern, combined with current market conditions, could offer a favorable risk-reward ratio for traders watching for breakout confirmation.
✅ Show your support by hitting the like button and
✅ Leaving a comment below! (What is You opinion about this Coin)
Your feedback and engagement keep me inspired to share more insightful market analysis with you!
XNO/NANO copying XRP price actionXNO looks like its almost copying XRPs bear market phase (blue chart is XRP). That means its time to accumulate XNO. It will likely take a few months to hold it until we see bull run which can take it towards previous bull run highs of 17$ or higher.

Those who like squeezing in the era of the dollar collapseEveryone’s eye to BTC, waiting for the next breakout... but something interesting is under the surface.
XNO NANO is one of the coins who under the radar by most people and could have the biggest HYPE and FOMO, but for most of the people, it will be too late ,
quietly getting squeezed. Supply is drying up, order books are thin, and whales are accumulating silently.
This week or next XNO is going crazy
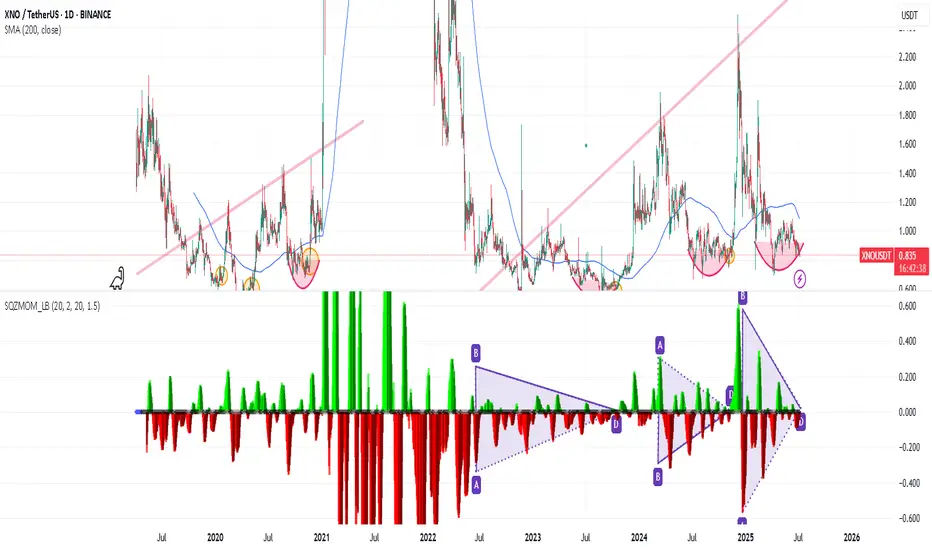
XNO is very bullish People will regret not buying in this zone, and anyone selling here is making a mistake. Think about it, and get in before it’s too late.

Nano Will Trade At $28 in 2025, A New All-Time HighIt will be a surprise for many. It will not be a surprise for me as you can see I am sharing the chart, but many people will be surprised to see Nano trading at $28 even if it last there only a few weeks.
$28 is the standard 2025 all-time high projection for this bull market. Notice that I mention bull market all the time but there isn't really any, this is just a prediction and it will become true very soon.
XNOUSDT is now out of the long-term accumulation zone. A zone (price range) that was active in 2019-2020, before the previous bull market and also in 2022, 2023, 2024 and briefly in 2025. So Nano gave us years to buy and accumulate at amazing prices. This is about to end.
Not all is bad news—this is actually good news. Low/good prices are over but growth/high profits will enter the picture.
In short, prices will go up. Growth is starting now. Long-term growth.
Expect a long stretch of higher highs and higher lows. Can be 4-6 months of bullish action. Can be a bit less or can be more. Err on the positive side.
Namaste.

Nano: Your Altcoin Choice (S2)Now this is a very simple yet strong bullish signal, it reveals everything. Notice the volume... XNOUSDT produced the highest volume session since December 2023. Back in 2023, this same signal happened before a major advance, the same will happen this time.
I don't need to go much about this one because we already know the future. XNOUSDT bottomed in November 2022—together with Bitcoin—a signal of strength. No new lows, no new All-Time Lows, the bottom happened years ago. The market has been growing slowly from the base, this is a strong pair. There is huge potential for growth.
The fact that the All-Time Low hasn't been challenged means that holders are not ready to part with their coins. This project has true support, real people behind the scenes. We also have higher highs based on candle close.
There are more signals. We have a higher low in 2025 vs the consolidation and low session of 2024. Higher low April 2025, low August 2024.
Last week was good even in isolation. Nano is a good pair to buy and hold.
I have two targets based on standard projections:
1) $28 which gives some 32X potential for profits.
2) $46 which gives some 52X potential for profits.
If this pair performs weakly, which is doubtful since it grew more than 6,666% between March 2020 and May 2021, we would still have some amazing growth.
Thanks a lot for your continued support.
Namaste.

XNOUSDT – The Market Moves, We React! I called this blue box before, and guess what? It delivered a massive 80% profit go check it below!
Now, we’re approaching a CRUCIAL moment, and you need to be on the right side of the trade.
📉 Short Setup?
If price reaches the red lines, I’ll be watching low time frame confirmations like a hawk. But let’s get this straight:
❌ No confirmation? No trade.
❌ No clear rejection? No gambling.
❌ No volume shift? I’m out.
📈 Breakout Scenario?
If price suddenly breaks upwards and doesn’t give a clean downside move in lower time frames, I will not insist on a short—because forcing trades is how people blow accounts. Instead, my strategy is simple:
✅ If price breaks out with volume and gives a clean retest, I will FLIP BULLISH and enter long.
✅ If it hesitates, rejects, and CDV confirms weakness—then we attack the short.
💡 Why This Works & Why You Need This Analysis:
Most traders guess—I wait for the market to confirm my ideas. That’s why I catch moves like this before they happen. No emotions. No guessing. Just data and execution.
⚡ The Game Plan:
🟢 React, don’t predict. The market doesn’t care about opinions.
🟢 Trade with smart risk. Protect capital, attack opportunities.
🟢 Follow the blueprint. Because winners have a plan.
You can watch or you can trade with a real edge. Your choice. 📊
A tiny part of my runners:
🎯 ZENUSDT.P: Patience & Profitability | %230 Reaction from the Sniper Entry
🐶 DOGEUSDT.P: Next Move
🎨 RENDERUSDT.P: Opportunity of the Month
💎 ETHUSDT.P: Where to Retrace
🟢 BNBUSDT.P: Potential Surge
📊 BTC Dominance: Reaction Zone
🌊 WAVESUSDT.P: Demand Zone Potential
🟣 UNIUSDT.P: Long-Term Trade
🔵 XRPUSDT.P: Entry Zones
🔗 LINKUSDT.P: Follow The River
📈 BTCUSDT.P: Two Key Demand Zones
🟩 POLUSDT: Bullish Momentum
🌟 PENDLEUSDT.P: Where Opportunity Meets Precision
🔥 BTCUSDT.P: Liquidation of Highly Leveraged Longs
🌊 SOLUSDT.P: SOL's Dip - Your Opportunity
🐸 1000PEPEUSDT.P: Prime Bounce Zone Unlocked
🚀 ETHUSDT.P: Set to Explode - Don't Miss This Game Changer
🤖 IQUSDT: Smart Plan
⚡️ PONDUSDT: A Trade Not Taken Is Better Than a Losing One
💼 STMXUSDT: 2 Buying Areas
🐢 TURBOUSDT: Buy Zones and Buyer Presence
🌍 ICPUSDT.P: Massive Upside Potential | Check the Trade Update For Seeing Results
🟠 IDEXUSDT: Spot Buy Area | %26 Profit if You Trade with MSB
📌 USUALUSDT: Buyers Are Active + %70 Profit in Total
🌟 FORTHUSDT: Sniper Entry +%26 Reaction
🐳 QKCUSDT: Sniper Entry +%57 Reaction
📊 BTC.D: Retest of Key Area Highly Likely
I stopped adding to the list because it's kinda tiring to add 5-10 charts in every move but you can check my profile and see that it goes on..

XNO 2600x gain ???If XNO follows XRP's path, we could see a 2600x gain, but this is not financial advice.
XNO (Nano) is considered the best payment crypto, as described by Grok.
Fundamentally, XNO is poised for massive gains in this bull run.

XNO 2025 TargetsXNO 2025 Targets
TP1: 5.0-5.2$
When v.28 is released, sentiment might turn. However, never be too confident and risk more than you can afford to lose as black-swan events can happen anytime.

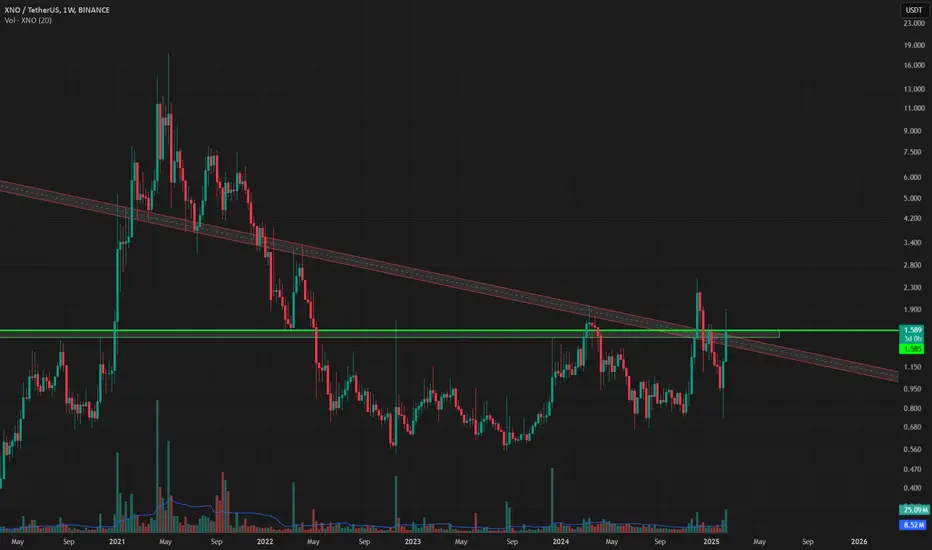
Nano closing above 1.585$ resistanceNano (XNO) has performed surprisingly well the last week, will the momentum continue? Will the price of 1.585$ turn from resistance into support? Time will tell!
BUY SPOT XNOUSDT (Short-Term H4-D1 Trade Setup)🚀 BUY SPOT XNOUSDT (Short-Term H4-D1 Trade Setup)
📢 XNOUSDT has not yet confirmed a strong uptrend on higher timeframes, and the W structure remains unclear. This presents an opportunity for a short-term trade to capture quick gains.
📌 Trade Plan & Market Outlook
✔ Market has not confirmed a full bullish structure, so this is a scalping/swing trade opportunity.
✔ Targeting a 30-50% gain, holding for a short period.
📌 Trade Setup:
Trade Type: Short-Term Spot Buy (H4-D1 cycle).
Entry Point: $1.3 - $1.5.
Target: Around $2 (~30-50% gain).
Hold Time: 1-2 days or intraday.
💡 Key Considerations:
✔ Execute trades within the entry zone to optimize R:R ratio.
✔ Monitor H4 momentum indicators for potential exit timing.
✔ Set stop-loss levels to manage downside risks.
🔥 XNOUSDT is a short-term opportunity – Trade smart & lock in quick profits! 🚀

XNOUSDT Analysis: Volume Spike with a Promising Blue Box EntryXNO
USDT Analysis: Volume Spike with a Promising Blue Box Entry
Key Points:
Daily Volume Spike: A significant 149% increase in daily volume suggests heightened activity in NANOUSDT.
Blue Box as Demand Zone: The blue box on the chart is identified as a solid entry zone for potential buyers.
Confirmation Checklist:
Before entering a position, I will confirm with:
Cumulative Delta Volume (CDV)
Liquidity Heatmap
Volume Profile
Volume Footprint
Upward Market Structure Breaks on Lower Time Frames
Additional Insight:
NANOUSDT’s volume increase indicates strong interest, but caution is advised due to overall market conditions. Always manage risk appropriately and consider waiting for confirmations in the blue box zone.
Learn Advanced Techniques:
Want to refine your entries like this? DM me to learn how to use CDV, heatmaps, and other key tools effectively.
Closing Note:
Patience and precision are key. The blue box looks like a solid demand zone—trade wisely and good luck!
If you think this analysis helps you, please don't forget to boost and comment on this. These motivate me to share more insights with you!
I keep my charts clean and simple because I believe clarity leads to better decisions.
My approach is built on years of experience and a solid track record. I don’t claim to know it all, but I’m confident in my ability to spot high-probability setups.
If you would like to learn how to use the heatmap, cumulative volume delta and volume footprint techniques that I use below to determine very accurate demand regions, you can send me a private message. I help anyone who wants it completely free of charge.
My Previous Analysis (the list is long but I think it's kinda good : )
🎯 ZENUSDT.P: Patience & Profitability | %230 Reaction from the Sniper Entry
🐶 DOGEUSDT.P: Next Move
🎨 RENDERUSDT.P: Opportunity of the Month
💎 ETHUSDT.P: Where to Retrace
🟢 BNBUSDT.P: Potential Surge
📊 BTC Dominance: Reaction Zone
🌊 WAVESUSDT.P: Demand Zone Potential
🟣 UNIUSDT.P: Long-Term Trade
🔵 XRPUSDT.P: Entry Zones
🔗 LINKUSDT.P: Follow The River
📈 BTCUSDT.P: Two Key Demand Zones
🟩 POLUSDT: Bullish Momentum
🌟 PENDLEUSDT.P: Where Opportunity Meets Precision
🔥 BTCUSDT.P: Liquidation of Highly Leveraged Longs
🌊 SOLUSDT.P: SOL's Dip - Your Opportunity
🐸 1000PEPEUSDT.P: Prime Bounce Zone Unlocked
🚀 ETHUSDT.P: Set to Explode - Don't Miss This Game Changer
🤖 IQUSDT: Smart Plan
⚡️ PONDUSDT: A Trade Not Taken Is Better Than a Losing One
💼 STMXUSDT: 2 Buying Areas
🐢 TURBOUSDT: Buy Zones and Buyer Presence
🌍 ICPUSDT.P: Massive Upside Potential | Check the Trade Update For Seeing Results
🟠 IDEXUSDT: Spot Buy Area | %26 Profit if You Trade with MSB
📌 USUALUSDT: Buyers Are Active + %70 Profit in Total
🌟 FORTHUSDT: Sniper Entry +%26 Reaction
🐳 QKCUSDT: Sniper Entry +%57 Reaction
📊 BTC.D: Retest of Key Area Highly Likely
I stopped adding to the list because it's kinda tiring to add 5-10 charts in every move but you can check my profile and see that it goes on..

XNO/USDT Breaks Out from Falling Wedge Anticipating 100%+ GainsXNO/USDT has recently exhibited a significant technical development, breaking out from a falling wedge pattern—a formation often indicative of a potential bullish reversal. This breakout, accompanied by substantial trading volume, suggests a shift in market sentiment towards optimism. Investors are now eyeing potential gains in the range of 100% to 120% or more, reflecting heightened interest in this project.
As of February 10, 2025, Nano (XNO) is trading at approximately $1.34, with an intraday high of $1.58 and a low of $1.098. This price movement underscores the volatility and the emerging bullish momentum in the market. The recent surge in trading volume further reinforces the positive outlook, as increased activity often correlates with growing investor confidence.
The successful breakout from the falling wedge pattern is a pivotal moment for XNO/USDT. Historically, such breakouts are followed by substantial upward price movements, especially when supported by strong volume. The current technical indicators align with this narrative, suggesting that XNO may be poised for significant appreciation in value.
In conclusion, the combination of the falling wedge breakout, robust trading volume, and renewed investor interest positions XNO/USDT as a compelling opportunity in the cryptocurrency market. Traders and investors should monitor this pair closely, as it exhibits the potential for notable gains in the near future.

Loading up on Nano hereLoading up on Nano here, with v28 (Electrum) on the way, Nano is looking brighter than ever before and can only get better from here. p.s: I love the technology

XNOUSDT Wyckoff AccumulationLooks like XNO is doing a Wyckoff accumulation that may extend until the end of October/November before making its bullish move. Targets in chart

Nano Long-Term Accumulation Channel Activated (+EZ Targets)➢ This trade-idea, this chart setup, this post, is only meant as a reminder; it is meant to alert you of a potentially good opportunity.
➢ In most of the cases, I am being ultra-conservative with the targets. Prices can go much, much, much higher than what is shown on the chart.
➢ Here is my thinking: If you can get a good entry, "great entry timing," then it is easy to profit once the market is full green.
➢ I give you the clear entry opportunity/reminder, and you take care of the decision making, the planning.
A great recent example is the RAREBTC chart. I gave a 125% target but the pair grew more than 300%. This pattern repeats all across. This is the case with this pair, Nano (XNOUSDT). It is meant to show the "accumulation zone," or as a reminder of a potential good entry for future growth.
With that said, let's look at this chart.
➖ Nano's "long-term accumulation channel" has been active since June 2022. If we consider data not shown on this chart, this channel has been valid since September 2019. So this is a major long-term accumulation zone and worked for accumulation for the 2021 bull-market.
➖ This zone is now active and can work again in anticipation of a major bullish wave and new bull-market (2025).
In short: The chart signals (technical analysis) are saying that this is a potentially good choice if the projection is bullish.
Thanks a lot for your continued support.
Namaste.
