XRP collapse to 75 cents underway? - November 2025Is XRP about to collapse faster than a vegan at a BBQ?
The idea “ XRP heading for 70% correction to 60 cents? ” was published at circa $2.90 after price action rallied almost 1000% throughout 2024. Price action continued to climb until $3.30 in the weeks ahead.
Naturally many took umbrage to any publisher who dared to suggest investors might do something as awful as, you know, sell after huge profits. Because making money is not the game, on no. Pledging your allegiance and unshakable faith is the true path to financial freedom. And if you believe that, I’ll tell you another... Trump and & Co. are taking up philanthropy.
The piffle from the congregation continues to entertain “Swift will be replaced by Ripple”, “Blackrock are going in big,”, “Why don’t you learn to read charts?”, every market top is the same. Liquid Euphoria.
The technical
A noteworthy development prints on the above weekly chart. A development that was fatal to any long investor who continued to ignore previous cycles. Once price action closed a candle body under the 50 week Simple Moving Average, the market dropped like a stone.
After the bearish divergence print in July (same strength as the bullish divergence print in March of 2020 at 14 cents) price action went on to break market structure. Bulls were unfazed by this development it would seem, but now a more serious development, the 50 week SMA breakdown.
Support and resistance is currently around 70 cents. Support never confirmed following the breakout. Previous collapses in price action align nicely with a 70% correction that would take price action back to the breakout should that correction strength repeat.
Conclusions
XRP has done it again, fooled the faithful into thinking this time it’s different. “Institutional money’s coming,” “the banks are loading up,” “Swift is finished!” Yeah, sure. And I’m the next Pope.
Look, I get it, every cycle needs its pantomime hero. However this isn’t a revolution; it’s déjà vu in high definition. The chart above doesn’t lie, the same structure, the same signals, and now the same 50-week breakdown that’s historically ended in tears. It’s not witchcraft, it’s statistics: Close below the 50-week SMA? → -60% to -80% every single time. RSI? Rolling over like a fainting goat. Support? Never confirmed. It’s all right there, hiding in plain sight while influencers keep shouting “bullish!” from their YouTube mansions.
Could it bounce? Sure. Dead cats do that too. But when every lower high is accompanied by louder noise and weaker conviction, you’ve got yourself less of an “investment” and more of a live action psychology experiment.
So, is XRP on death’s door?
Let’s just say it’s knocking politely and the door’s already open.
Ww
Disclaimer
=========================================================
This isn’t financial advice. Obviously. If you’re basing your investment strategy on what some bloke on the internet with access to a TradingView account says, you deserve whatever cinematic tragedy comes next.
I don’t work for Ripple, I don’t hate Ripple, and I definitely don’t think Ripple’s going to replace Swift, unless Swift suddenly stops working and forgets how to money. So, do your own research, manage your own risk, and for the love of all things holy, stop confusing hopium with a business model.
If XRP moons, great, tell me all about it while I pretend to care. If it crashes 80%, well… don’t say the moving averages didn’t warn you.
Trade ideas

XRP: Target Zone in sightRipple’s XRP has seen a modest rebound recently, but this hasn’t altered our outlook. We continue to expect further declines as part of a blue five-wave move down into the turquoise Target Zone ($1.03–$0.38), which is suitable for long-side entries. Within this zone, we anticipate that the low of the larger wave B in turquoise will be established. From there, we expect wave C to rally above resistance at $4.09 and complete the larger wave (Y) in magenta. We still assign a 30% probability to the scenario in which the low of wave alt.B in turquoise has already been reached.

XRP TARGET 25$XRP/BTC is at bottom. while many alts are ongoing extreme rapid growth like march 2017

Do you think I'm joking ???The price is currently moving within a bullish channel and may reach the upper boundary of this channel. If the channel is broken to the upside, we can expect a new all-time high (ATH) for Ripple.

Once and for all - Why not :)Anything is possible - i never doubt it. Somebody got to clear the marking.

XRP - 4hr chartDoes XRPL connect to Corda Settler & R3, Xinfin, UCC(4), ISO20022, MLETR, and did the nation of Palu, using a gold backed USD denominated currency test the XRPL?
Dont hate, speculate.
XRPL features Atomic settlement and rippling feature perfect for global payments. The utility is there for something, ask your favorite a.i companion.
T.A explained -
BackSide (BS)
FrontSide (FS)
Inverse BS (Inv.BS)
Inverse FS (Inv.FS)
BS & FS levels are expected support when dashed lines, tested when dotted and resistance when solid lines.
The inverse is true for the Inv. BS Inv. FS levels, they are resistance as dashed lines, tested as dotted and support as solid lines.
Monthly timeframe is color pink
weekly grey
daily is red
4hr is orange
1hr is yellow
15min is blue
5min is green if they are shown.
strength favors the higher timeframe.
2x dotted levels are origin levels where trends have or will originate. When trends break, price will target the origin of the trend. its math, when the trend breaks, the vertex breaks too so the higher timeframe level/trend that breaks, the more volatility there could be as strength in the orders flow in to fuel the move.
yesterday
Trade closed manually
price followed the candle science and timeframes from the 5min green levels to the weekly grey level. Price has left behind some inverse frontside and inverse backside candles which look to be forming the bridge to flip the script if price manages to gain those levels and start accumulation. That liquidity will "unlock" and fuel price action.

BTC, XRP, XAU, & Global M2XRPUSD & BTCUSD were following the global M2 money supply (with an 80 day offset) from at least early 2024 to end of May 2025 but have since not kept up with the money supply.
Gold (with a -20 day offset) has followed the M2 supply closely.

Ripple Labs Inc. Expands Beyond Crypto Into Traditional Finance Ripple Labs, the blockchain company behind XRP, is making a strategic shift that could reshape its role in global finance. CEO Brad Garlinghouse confirmed at the Ripple Swell 2025 conference that the firm is deepening its expansion beyond crypto, targeting traditional financial services through blockchain-driven infrastructure.
Over the past year, Ripple has spent nearly $4 billion acquiring traditional finance firms, including Hidden Road ($1.3B) and GTreasury ($1B+), as part of a long-term plan to integrate blockchain solutions into established financial systems. The company’s latest initiative — a prime brokerage offering over-the-counter spot trading for institutions — reflects Ripple’s goal to bridge crypto liquidity with traditional finance.
The timing is favorable. Under a more crypto-friendly U.S. administration, both the SEC and CFTC have eased regulatory pressures, encouraging major banks such as Citi, JPMorgan, and Bank of America to explore tokenization and stablecoin infrastructure. Ripple aims to position itself at the center of this transition by licensing its XRP Ledger (XRPL) to institutions seeking faster and cheaper transaction rails.
Technically, XRP/USD is showing early signs of basing after months of sideways movement. Price currently hovers near the $2.30–$2.40 zone, with strong support forming at $1.80–$2.00. If bulls defend this level, the setup suggests a potential mid-term rebound toward $3.60, the upper resistance zone highlighted on the chart. A breakout above that range could confirm a new bullish cycle aligned with Ripple’s growing institutional adoption.
With both technical and fundamental catalysts converging, Ripple’s ambition to merge crypto with traditional finance could make XRP one of the most strategically positioned digital assets heading into 2026.

$XRP in a major accumulation area.CRYPTOCAP:XRP in a major accumulation area.
Wyckoff Method Scenario Repeating.
XRP is trading in a classic Accumulation Phase according to the Wyckoff method.
Technically, this structure is leading to a strong bullish cycle.
Following a similar accumulation period in 2017, XRP began a parabolic run and rose to the Distribution zone.

XRP $17The Target 3 moon mission is preparing for launch.
The #Huntvolatility funnel is well underway.
Targets 1 and 2 have already been achieved and honoured.
In my humble opinion, we are poised to exceed many people's dream level of $10.
It's important to manage your risk as we ascend...
T3 may very well be exceeded.
However, it's crucial to adhere to your own trading strategy and financial objectives.
As we all know, the crypto market is extremely volatile.
Wishing everyone good luck.

Bearish OBV Divergence Confirms Resistance HoldXRP is currently facing significant overhead resistance around the $2.55 level. Despite the previous attempt, the price failed to sustain its momentum , and a combination of poor overall market sentiment and an increasingly bearish volume profile suggests a strong likelihood of a rejection.
The cryptocurrency market is experiencing a significant "fear" phase. Bitcoin (BTC) and Ethereum (ETH) are showing signs of weakness or consolidating, which typically drains liquidity and confidence from altcoins like XRP. It is incredibly difficult for any altcoin to sustain a major breakout against a bearish overall market conditions.
If the price manages to break and close and retest above resistance zone, we might have a healthy long opportunity.
Good Luck!

XRP BUYPrice broke above the last Lower High (LH) and formed a new Higher High (HH), confirming a shift to bullish structure. After that move, it pulled back into the breakout zone, now acting as demand, where buyers look to step back in.
As long as price holds above this level, I’m keeping a bullish bias with targets toward the previous HH. A break below the current HL would invalidate the setup — that’s where my stop loss sits.
Entry: 2.40947
Stop Loss: 2.34257
Take Profit: 2.61517

XRPUSD Has it started its Bear Cycle already?XRP (XRPUSD) has been trading within a Channel Up ever since the March 09 2020 bottom of the COVID flash crash. Even though the recent Bull Cycle didn't hit the pattern's Top (Higher Highs), signs have emerged that the new Bear Cycle may have started.
The most obvious of those are the break (and closing) below the 1W MA50 (blue trend-line). Last month's flash crash even touched the 1W MA100 (green trend-line) before immediately recovering.
Most importantly, XRP already filled the 2.5 Fibonacci extension level with its July 14 2025 All Time High (ATH), which is exactly where the High of the previous Cycle was priced (April 12 2021). What followed afterwards, especially when it closed a week below the 1W MA50 (November 29 2021) is very similar to what has been taking place in the past 3 months (especially with the 1W MA50 break 30 days ago) and the similarities between the 1W RSI patterns further justify it.
As a result, since the 2022 Bear Cycle bottomed on the 1M MA100 (red trend-line) and just below its 0.618 Fibonacci retracement level, we expect the current to do the same and target $0.9000 (Fib 0.618). An additional indicator that may help at identifying the bottom (hence a good level to start buying again), is when the 1W RSI breaks below its 30.00 oversold barrier.
-------------------------------------------------------------------------------
** Please LIKE 👍, FOLLOW ✅, SHARE 🙌 and COMMENT ✍ if you enjoy this idea! Also share your ideas and charts in the comments section below! This is best way to keep it relevant, support us, keep the content here free and allow the idea to reach as many people as possible. **
-------------------------------------------------------------------------------
💸💸💸💸💸💸
👇 👇 👇 👇 👇 👇

XRPUSD: Ascending Triangle in Play – 2.550 is the Key!📈 XRPUSD: Ascending Triangle in Play – Bulls Eyeing 2.700, But 2.550 is Key!
Timeframe: 4-Hour Chart
Ripple (XRPUSD) on the 4-hour chart is currently trading around $2.458, demonstrating a fascinating consolidation pattern. The price is navigating a critical "Deciding Area" while being supported by a robust ascending trendline, setting the stage for a potentially significant move.
Current Price Action & Trend Analysis:
XRPUSD has been in a period of upward consolidation since finding a strong base around the 2.1 level in early November. This recovery has been characterized by higher lows, clearly illustrated by the ascending green trendline acting as dynamic support. Recently, the price has successfully bounced off this trendline, showing resilience and continued buying interest at lower levels.
However, overhead resistance around the 2.550 'Deciding Area' has proven to be a significant challenge. XRP has been rejected from this zone multiple times, preventing a clear breakout to higher targets. This interaction between the ascending support and the horizontal resistance around 2.550 suggests the formation of an ascending triangle pattern, indicative of accumulation or preparation for a breakout. The current price action sees XRP testing the lower boundary of the 2.550 area, attempting to build momentum for a breach.
Key Resistance Levels:
2.550 Deciding Area: This is the most immediate and critical resistance. A decisive break and sustained close above this zone, ideally with increased volume, would be a strong bullish signal.
2.700 Upside 1st Target: Should XRP successfully break above 2.550, the 2.700 level is identified as the 'Upside 1st Target'. This previous swing high would be the next major hurdle.
2.90 to 2.95 Flip Zone: Beyond 2.700, this zone represents a significant 'Flip Zone' where previous resistance could turn into support, or vice versa, indicating a substantial bullish push.
Key Support Levels:
Ascending Green Trendline: This dynamic trendline is providing immediate support, dictating the higher lows in the current consolidation. A break below this trendline would invalidate the current bullish structure.
2.300 Downside 1st Target: If the ascending trendline fails, the next significant support is the 2.300 'Downside 1st Target'. This level could attract buyers, but a breach here would signal increased bearish pressure.
2.1 Next Support: This strong green zone represents the 'Next Support' level, a crucial area that held strong in early November. A break below 2.300 could lead to a test of this significant psychological and technical level.
Bullish Scenario:
The most bullish outcome involves XRPUSD securing a decisive breakout above the 2.550 'Deciding Area'. A sustained move above this resistance would confirm the strength of the ascending triangle pattern and likely pave the way for a rally towards the 2.700 'Upside 1st Target', with further upside potential towards the 2.90-2.95 'Flip Zone'.
Bearish Scenario:
Conversely, a failure to break above 2.550, combined with a decisive breakdown below the ascending green trendline, would be a significant bearish development. Such a move would likely lead to a test of the 2.300 'Downside 1st Target'. If this support is also breached, XRP could see a further decline towards the strong 2.1 'Next Support' level.
Conclusion:
XRPUSD is currently in a high-stakes consolidation, with the 2.550 'Deciding Area' acting as a critical battleground. The ascending green trendline provides crucial support, but repeated rejections from the overhead resistance highlight the need for a definitive breakout. Traders should meticulously watch for a clear break in either direction from this pattern to anticipate XRP's next major move.
Disclaimer:
The information provided in this chart is for educational and informational purposes only and should not be considered as investment advice. Trading and investing involve substantial risk and are not suitable for every investor. You should carefully consider your financial situation and consult with a financial advisor before making any investment decisions. The creator of this chart does not guarantee any specific outcome or profit and is not responsible for any losses incurred as a result of using this information. Past performance is not indicative of future results. Use this information at your own risk. This chart has been created for my own improvement in Trading and Investment Analysis. Please do your own analysis before any investments.

XRP/USD (4H timeframe)Market Structure:
Price has broken below the mid-range support around 2.77 – 2.80 zone, turning it into resistance.
The market has formed lower highs and lower lows, confirming a downtrend structure.
📉 Bearish Scenario:
The red zone around 2.77 – 3.00 acts as a supply zone / resistance area.
Price may retest this area before continuing downward.
The projected target (based on your arrow) is around 1.31, which aligns with the previous demand/support zone from earlier in 2025.
🎯 Key Levels:
Resistance (Sell Zone): 2.77 – 3.00
Current Price: ~2.28
Target (Support Zone): 1.30 – 1.35
Invalidation (Stop Loss Zone): Above 3.00
⚙️ Technical Confluence:
Break and retest pattern after bearish momentum.
Previous structure support now acting as resistance.
Potential Fibonacci retracement from last drop aligns near 2.77 zone (~0.618 level).
📊 Bias:
➡️ Bearish bias unless price reclaims and closes above 3.00 on 4H or Daily timeframe.

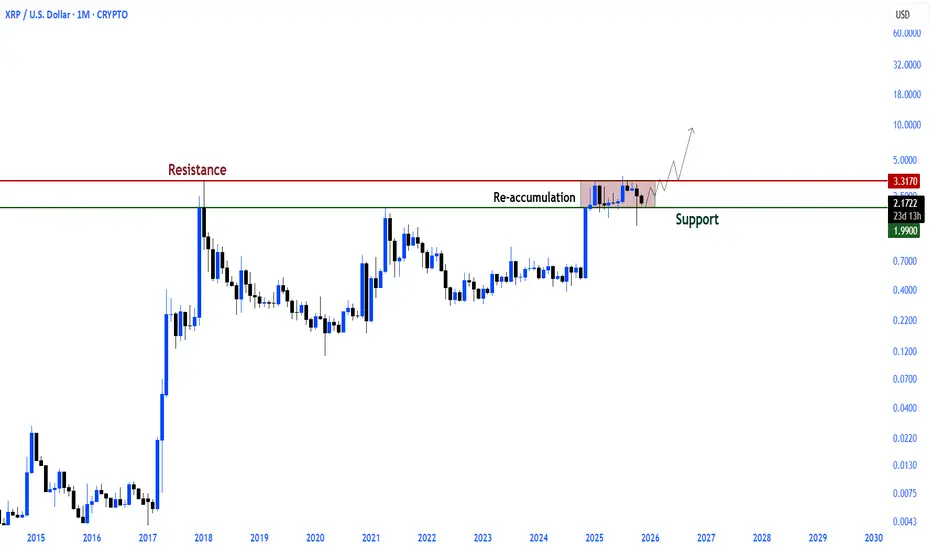
The table is clear in $XRP
Ripple is still in a clear re-accumulation phase between the $3.3 major resistance and the $1.99 support.
Unless the structure is broken, this silence will trigger a new leg.
XRP 1 to 8 buy the target is about to be hit , so take your saving and put them on this position and this will be my last call for this year ; i m about to close 1 M in this year thanks to God and discipline

XRPThe next five days will tell us everything we need to know above white line bullish (imo that next leg up)
Below we continue a bearish .

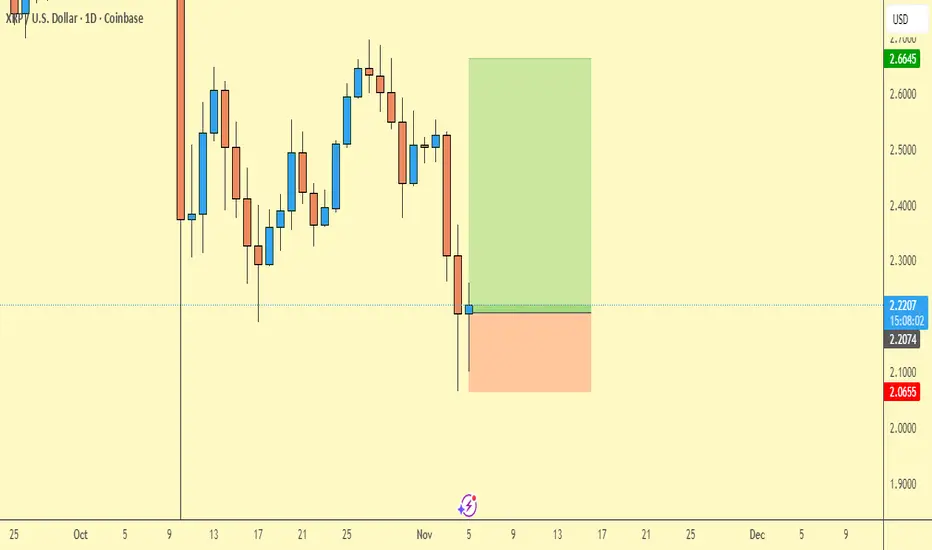
XRP/USD – Bullish Outlook XRP has bounced strongly from a key support zone, showing clear bullish momentum around $2.20. Buyers are stepping in, and if this continues, we could see moves toward $2.70 → $3.09 → $3.66 — gains of up to 60% from current levels.
There’s also big excitement around a possible XRP ETF. If approved, it could push XRP toward $5, and maybe even $10 — a potential monster move! 💥
For those new to crypto: XRP is one of the best coins for fast, low-cost transfers and is even used by banks for international payments — giving it real-world strength. 🌍
Chart looks bullish — momentum is building.

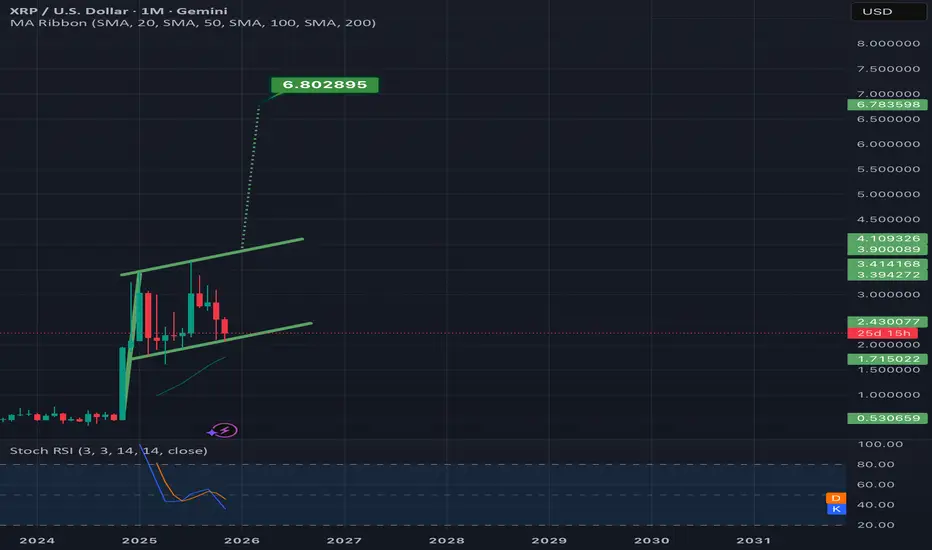
Bullflag on xrp has a target of $6.80 if it validates n DecemberWill be a very good sign if it finds a way to hold this bottom trendline as support.Even if it does hold support a wick below it is still very possible. *not financial advice*
XRP Technical Outlook: Channel Break Could Signal New Highs !!The price is currently moving within a bullish channel and may reach the upper boundary of this channel. If the channel is broken to the upside, we can expect a new all-time high (ATH) for Ripple.

XRP 10/16Not financial advice, just sharing what I have had for the last few months. XRP is not for the weak! Enjoy these buying opportunities before they flip more switches! Diamond hands.