how to Stop Your Money Losing Value??Have you ever felt that despite your hard work, your purchasing power is fading? This is an invisible war, a war where your cash is on the losing side. But there are practical ways to protect your assets and even grow them in the long term.
Hello✌️
Spend 3 minutes ⏰ reading this educational materia
Related pairs

#XRPUSDT: Bullish Reversal Coming With Price Heading Back To 3.5## XRPUSDT Analysis: Long-Term Perspective
In the long term, we anticipate the XRPUSDT price to revert to its all-time high of 3.5. From a fundamental analysis standpoint, we maintain a positive outlook, with the potential for the price to surpass 3.5. We have identified a favourable trading opportu

XRPUSDT.P - November 12, 2025XRPUSDT.P is showing potential for a short-term bullish reversal after stabilizing near the $2.3779 support zone. The pair is attempting to break above a descending trendline, which has contained price action throughout the recent downtrend. A confirmed breakout and sustained move above the $2.4399

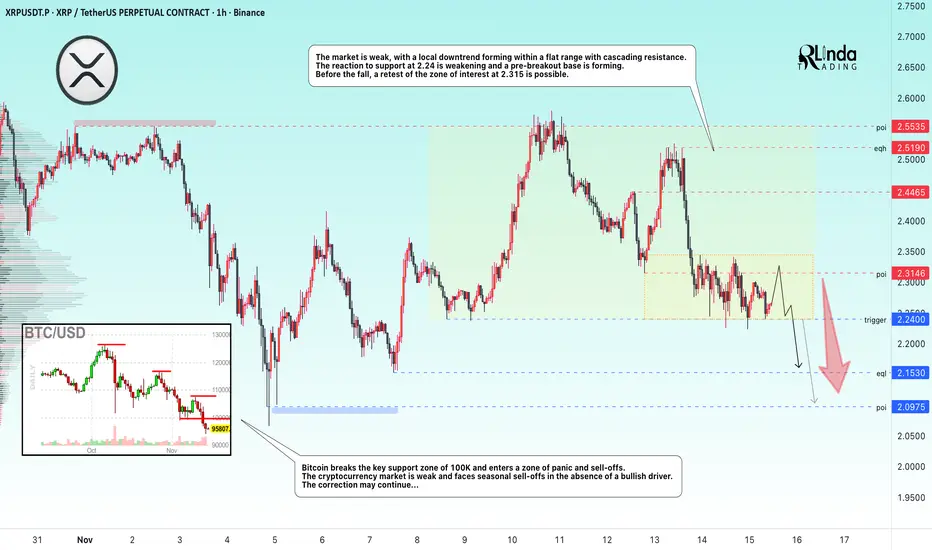
XRPUSDT → False breakout of resistance in a weak marketBINANCE:XRPUSDT faces strong resistance and forms a false breakout amid a weak market. Bearish pressure remains high...
Bitcoin failed to break through the 106K resistance and returned to the short zone, with the cryptocurrency market, including XRP, reacting with a decline... Overall, the mar

XRPUSDT.P - November 14, 2025XRPUSDT on the 15-minute chart is stabilizing after a sharp decline, forming a short-term base above $2.26. Price is currently compressing beneath a clear intraday resistance band around $2.34–$2.35, which aligns with the marked breakout level. A decisive push and sustained hold above this zone woul

Way that i think ,the graphic XRP/USDT it Is going to do Abaut actually frame of tarde over the price of XRP ,from my personal opinion the price have to take the 2.60 USDT per XRP to this moment ahead

Buy XRP right now!
It's time right now to buy #XRP $XRP. Target 2.45 to unwind some of what you buy now. (maybe all of it)

XRP/USDT — Reversal Incoming or Deeper Breakdown?XRP is now standing at a make-or-break point. After weeks of movement inside a well-defined descending channel, price is once again testing the critical support zone at 2.32–2.17 — the level that has repeatedly acted as the last line of defense for the bulls.
This zone has held multiple times, yet e

Lingrid | XRPUSDT Downside Pressure AcceleratingBINANCE:XRPUSDT trades below the descending trendline inside a clearly defined downward channel, keeping the broader structure bearish. Price action has recently tested the $2.44 zone but failed to sustain a breakout, signaling continued weakness. As long as the pair stays under $2.50 resistance, a

XRPUSDT → Consolidation before breaking through support BINANCE:XRPUSDT continues to storm the 2.24 support level amid a downtrend and a weak market. There is no bullish driver, and the fundamental background is also weak...
Bitcoin breaks through the key support zone of 100K and enters a zone of panic and sell-offs. The cryptocurrency market is we
See all ideas
Summarizing what the indicators are suggesting.
Oscillators
Neutral
SellBuy
Strong sellStrong buy
Strong sellSellNeutralBuyStrong buy
Oscillators
Neutral
SellBuy
Strong sellStrong buy
Strong sellSellNeutralBuyStrong buy
Summary
Neutral
SellBuy
Strong sellStrong buy
Strong sellSellNeutralBuyStrong buy
Summary
Neutral
SellBuy
Strong sellStrong buy
Strong sellSellNeutralBuyStrong buy
Summary
Neutral
SellBuy
Strong sellStrong buy
Strong sellSellNeutralBuyStrong buy
Moving Averages
Neutral
SellBuy
Strong sellStrong buy
Strong sellSellNeutralBuyStrong buy
Moving Averages
Neutral
SellBuy
Strong sellStrong buy
Strong sellSellNeutralBuyStrong buy
Displays a symbol's price movements over previous years to identify recurring trends.
Frequently Asked Questions
The current price of XRP / USDT (XRP) is 2.2214 USDT — it has risen 1.78% in the past 24 hours. Try placing this info into the context by checking out what coins are also gaining and losing at the moment and seeing XRP price chart.
XRP / USDT price has fallen by −1.37% over the last week, its month performance shows a −5.32% decrease, and as for the last year, XRP / USDT has increased by 149.18%. See more dynamics on XRP price chart.
Keep track of coins' changes with our Crypto Coins Heatmap.
Keep track of coins' changes with our Crypto Coins Heatmap.
XRP / USDT (XRP) reached its highest price on Jul 18, 2025 — it amounted to 3.6642 USDT. Find more insights on the XRP price chart.
See the list of crypto gainers and choose what best fits your strategy.
See the list of crypto gainers and choose what best fits your strategy.
XRP / USDT (XRP) reached the lowest price of 0.1038 USDT on Mar 13, 2020. View more XRP / USDT dynamics on the price chart.
See the list of crypto losers to find unexpected opportunities.
See the list of crypto losers to find unexpected opportunities.
The safest choice when buying XRP is to go to a well-known crypto exchange. Some of the popular names are Binance, Coinbase, Kraken. But you'll have to find a reliable broker and create an account first. You can trade XRP right from TradingView charts — just choose a broker and connect to your account.
Crypto markets are famous for their volatility, so one should study all the available stats before adding crypto assets to their portfolio. Very often it's technical analysis that comes in handy. We prepared technical ratings for XRP / USDT (XRP): today its technical analysis shows the sell signal, and according to the 1 week rating XRP shows the sell signal. And you'd better dig deeper and study 1 month rating too — it's buy. Find inspiration in XRP / USDT trading ideas and keep track of what's moving crypto markets with our crypto news feed.
XRP / USDT (XRP) is just as reliable as any other crypto asset — this corner of the world market is highly volatile. Today, for instance, XRP / USDT is estimated as 1.59% volatile. The only thing it means is that you must prepare and examine all available information before making a decision. And if you're not sure about XRP / USDT, you can find more inspiration in our curated watchlists.
You can discuss XRP / USDT (XRP) with other users in our public chats, Minds or in the comments to Ideas.