#XRPUSDT: Bullish Reversal Coming With Price Heading Back To 3.5## XRPUSDT Analysis: Long-Term Perspective
In the long term, we anticipate the XRPUSDT price to revert to its all-time high of 3.5. From a fundamental analysis standpoint, we maintain a positive outlook, with the potential for the price to surpass 3.5. We have identified a favourable trading opportunity, as illustrated in the chart.
Our approach is neutral, as the trend remains undecided. Based on the duration of your positions, you can set two targets:
1. **Short-Term Target:** If you intend to hold your positions for a short period, aim for a price level above 3.5.
2. **Long-Term Target:** For long-term investors, a target price of 4.0 or higher is plausible.
We are committed to providing comprehensive analysis and support. Should you have any inquiries or require further clarification, please do not hesitate to contact us.
Additionally, we would appreciate your insights on which cryptocurrency pair you would like to explore next.
Regards,
Team Setupsfx_
Trade ideas

how to Stop Your Money Losing Value??Have you ever felt that despite your hard work, your purchasing power is fading? This is an invisible war, a war where your cash is on the losing side. But there are practical ways to protect your assets and even grow them in the long term.
Hello✌️
Spend 3 minutes ⏰ reading this educational material.
🎯 Analytical Insight on Ripple:
XRP is testing a strong support while moving on the descending channel. A confirmed breakout with solid volume could drive a 20% rally, targeting 2.80$. 📊🚀
Now , let's dive into the educationa l section,
🛡️ Understanding the Invisible Enemy
Inflation is the primary enemy of your capital. This phenomenon slowly but surely erodes the value of your money. When the bank interest rate is lower than the inflation rate, you are effectively losing your wealth. The main goal is to find a way to achieve returns higher than the inflation rate.
🌍 The Mindset of a Preserver
The first step is to shift your mindset from a "saver" to an "investor". Your money should work for you, not the other way around. This mindset forces you to always look for opportunities that not only preserve but also increase the value of your assets.
📈 Smart Diversification
Never concentrate all your assets in one investment class. A mix of different assets such as stocks, commodities, and digital assets can form a strong shield against market fluctuations. The principle of diversification significantly reduces the risk of losing your entire capital.
⚙️ The Art of Risk Management
Preserving capital takes priority over making profits. Only enter trades with capital whose loss would not affect your current lifestyle. Setting a stop-loss for every investment position is a necessity, not an option. This protects you from negative market surprises.
🧠 Mastering Psychology
Fear and greed are two powerful and destructive emotions in the market. The fear of missing out causes you to lose golden opportunities, and greed pushes you to hold investments at price peaks. To succeed, you must overcome these emotions and stick to your strategy.
🔍 Identifying Opportunities with Trading views Tools
This section focuses on the practical search for assets with potential. Analytical tools can provide you with a better perspective for this task.
Market Scanner: Use this tool to screen thousands of assets based on specific technical criteria. You can find assets that have crossed an important moving average or are consolidating within a specific range.
Creating Charts: Create different charts for one asset and use indicators in combination. Comparing an asset's performance against others can reveal its strengths and weaknesses.
Sharing Feature: Share your ideas and analyses with the large community of users and benefit from their feedback. This helps you see hidden aspects of a situation.
🎯Top Recommendations for Action
First, have a written trading plan for yourself and do not take any action without it. Second, always withdraw a portion of your profits from the market and convert them into lower-risk assets. Third, never stop learning; markets are dynamic, and yesterday's strategies may not work tomorrow.
🚀 Final Word
Preserving the value of money is not an event; it is a continuous process. This path is paved with education, consistent analysis, and emotional control. By using the right tools and adhering to principles, you can protect your assets against inflation.
✨ Need a little love!
We pour love into every post your support keeps us inspired! 💛 Don’t be shy, we’d love to hear from you on comments. Big thanks , Mad Whale 🐋
📜Please make sure to do your own research before investing, and review the disclaimer provided at the end of each post

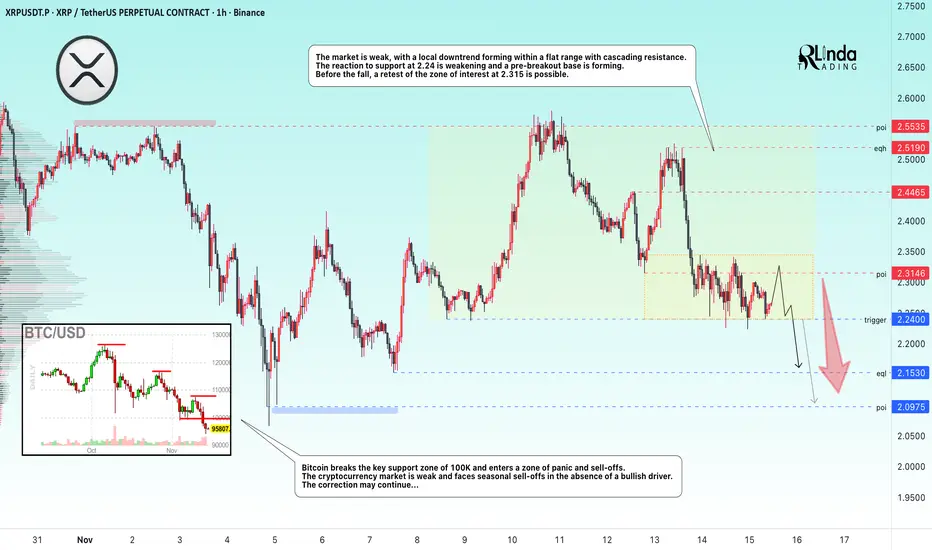
XRPUSDT → Consolidation before breaking through support BINANCE:XRPUSDT continues to storm the 2.24 support level amid a downtrend and a weak market. There is no bullish driver, and the fundamental background is also weak...
Bitcoin breaks through the key support zone of 100K and enters a zone of panic and sell-offs. The cryptocurrency market is weak and facing seasonal sell-offs in the absence of a bullish driver. The correction may continue...
XRP is forming a local downtrend with cascading resistance within a flat. The reaction to the 2.24 support is weakening and a pre-breakout base is forming. Before the fall, a retest of the 2.315 zone of interest is possible.
Resistance levels: 2.315, 2.4465
Support levels: 2.24, 2.153, 2.097
A false breakout of 2.3146 could trigger a further decline, but a close below 2.153 could trigger a sell-off and a subsequent decline to the 2.153-2.097 zone.
Best regards, R. Linda!
XRPUSDT.P - November 12, 2025XRPUSDT.P is showing potential for a short-term bullish reversal after stabilizing near the $2.3779 support zone. The pair is attempting to break above a descending trendline, which has contained price action throughout the recent downtrend. A confirmed breakout and sustained move above the $2.4399 resistance level could signal renewed buying interest. If momentum builds, price action may target the $2.5758 profit level, representing the next key upside objective.
The stop level is positioned around $2.3148–$2.3200, marking the invalidation area for this bullish setup and protecting against a deeper correction.
Risk Assessment: Moderate to High — While early signs of a trend reversal are forming, XRPUSDT.P remains within a broader bearish structure. Failure to hold above the $2.38 zone or rejection from the trendline could trigger a renewed selloff toward $2.32 or lower. Confirmation above $2.44 is essential for a stronger bullish case.

XRPUSDT → False breakout of resistance in a weak marketBINANCE:XRPUSDT faces strong resistance and forms a false breakout amid a weak market. Bearish pressure remains high...
Bitcoin failed to break through the 106K resistance and returned to the short zone, with the cryptocurrency market, including XRP, reacting with a decline... Overall, the market is in a weak phase and is not yet ready to move into strong growth. Consolidation may continue...
False breakout of resistance at 2.5530 amid a weak market. The market has no potential for continued growth, and a reversal pattern is forming, provoking a sell-off...
Resistance levels: 2.496 - 2.553
Support levels: 2.376, 2.24
A retest of the local base at 2.5 is possible before the decline continues. As part of the current movement, the market may test 2.37, but if the bulls fail to hold this zone, the coin may drop to 2.24.
Best regards, R. Linda!

XRPUSDT.P - November 14, 2025XRPUSDT on the 15-minute chart is stabilizing after a sharp decline, forming a short-term base above $2.26. Price is currently compressing beneath a clear intraday resistance band around $2.34–$2.35, which aligns with the marked breakout level. A decisive push and sustained hold above this zone would signal bullish momentum returning, opening room for a continuation move toward the $2.50–$2.52 profit target. Failure to break higher keeps price vulnerable to another retest of the lower support region, and a breakdown below $2.26 would invalidate the bullish setup and expose further downside.

Lingrid | XRPUSDT Flag Pattern Exit Downside MoveBINANCE:XRPUSDT remains trapped inside a clear downward channel, repeatedly rejecting both the resistance trendline and the mid-range supply zone around 2.4150. The chart shows multiple fake breaks and failed bullish attempts, confirming sellers are still in control. Price is now forming a small corrective bounce, but the structure points to a continuation pattern toward the lower support. As long as CRYPTOCAP:XRP stays below 2.4150, the likelihood of a bearish extension toward the 2.0000 target zone remains high.
⚠️ Risks:
A clean breakout above 2.4150 may invalidate the bearish continuation.
Strong market-wide bullish momentum could slow down the drop.
Sideways compression within the flag could delay the move.
If this idea resonates with you or you have your own opinion, traders, hit the comments. I’m excited to read your thoughts!

Way that i think ,the graphic XRP/USDT it Is going to do Abaut actually frame of tarde over the price of XRP ,from my personal opinion the price have to take the 2.60 USDT per XRP to this moment ahead

XRP/USDT — Reversal Incoming or Deeper Breakdown?XRP is now standing at a make-or-break point. After weeks of movement inside a well-defined descending channel, price is once again testing the critical support zone at 2.32–2.17 — the level that has repeatedly acted as the last line of defense for the bulls.
This zone has held multiple times, yet each bounce has been capped by the upper boundary of the channel — forming a classic corrective structure where bearish momentum gradually weakens, preparing for a potential breakout phase.
---
📊 Pattern & Technical Structure
The chart reveals a descending channel pattern, typically signaling a corrective or consolidation phase within a broader market cycle.
Lower boundary of the channel → potential accumulation area and source of rebound.
Midline → dynamic resistance that has repeatedly rejected upward attempts.
Support box 2.32–2.17 → the decision zone, where bulls and bears will soon reveal the next major trend.
Failure to hold this level could trigger another leg down, while a strong defense here could mark the beginning of a larger trend reversal.
---
🚀 Bullish Scenario
A bullish breakout setup will be confirmed if:
1. Price closes above the descending channel with strong daily momentum.
2. The breakout is followed by a successful retest of 2.75 as a new support.
3. Upside targets then lie at 3.09 – 3.32 – 3.56 – 3.66, representing potential wave extensions.
If validated, this move could trigger a powerful recovery rally and possibly signal a major bullish reversal on the higher timeframes.
---
🔻 Bearish Scenario
On the flip side, if the 2.17 support fails to hold and a daily close occurs below this zone, then:
Price could continue sliding toward the lower boundary of the channel (1.95–1.80),
Extending the correction phase,
And potentially forming a lower-low structure in continuation of the broader downtrend.
This would confirm a sustained bearish control in the medium term.
---
📍 Conclusion
XRP is at the edge of compression, where the next decisive move will define its next big trend.
This descending channel may soon reveal whether it’s a bear trap before a breakout, or the start of another downward leg.
The reaction at the 2.32–2.17 zone will decide everything — this is the battlefield between reversal and breakdown.
Watch for daily closes, volume confirmation, and price behavior around the upper boundary of the channel.
Smart traders know — the calm before the breakout is where the biggest opportunities are born.
---
#XRP #XRPUSDT #Ripple #CryptoAnalysis #TechnicalAnalysis #DescendingChannel #PriceAction #SupportResistance #CryptoBreakout #SwingTrade #ChartPattern

Lingrid | XRPUSDT Downside Pressure AcceleratingBINANCE:XRPUSDT trades below the descending trendline inside a clearly defined downward channel, keeping the broader structure bearish. Price action has recently tested the $2.44 zone but failed to sustain a breakout, signaling continued weakness. As long as the pair stays under $2.50 resistance, a retest toward $2.00 support remains the likely path. Momentum indicators align with a slow drift lower, reinforcing short-term bearish control.
⚠️ Risks:
A sudden Bitcoin rally could lift altcoins and negate the bearish setup.
Positive regulatory news around XRP may trigger unexpected volatility.
U.S. macro data or risk sentiment shifts could strengthen USD demand dynamics.
If this idea resonates with you or you have your own opinion, traders, hit the comments. I’m excited to read your thoughts!

The Final Crypto Shakeout Before The Big Move?Everyone’s Bearish… I Couldn’t Be More Bullish!
In this video, I break down the current crypto market after a strong weekly close. While everyone is panicking and calling for a bearish trend, I see the opposite. This is exactly what we want to see before the next big move.
Here’s what I cover:
-Total Market Cap, BTC, BTC CME Gap, ETH, and XRP analysis
-Why fear in the market = opportunity
-The final possible sweep in December before the next leg higher
-My current XRP position and what I’m watching next
The market rewards patience, not panic — this is the time to stay focused and think smart.
#Crypto #Bitcoin #Ethereum #XRP #BTC #ETH #Altcoins #CryptoTrading #ICTStrategy #MarketAnalysis

XRPUSDT: Precision at WorkHere is how my discipline performed on the 4H chart. On October 20, after clear analysis and visualization of key levels, I took a long decision at 2.4335 and entered on the next candle without haste strictly by plan. Then came meticulous execution: I mapped four take profit levels, allocated the deposit across the steps, and kept risk under control. No improvisation: only predefined rules and a secret proprietary strategy that structures entry and exit points and sets clear position management boundaries.
The result over a few days all four TPs were hit. In total I captured about 6% with 3x leverage. What matters is that I did not chase the perfect top I took what the market offered at my levels. The chart validated the scenario: impulse partial profit taking reset in the consolidation zone and then continuation in my direction.
Yes those who hesitated or jumped in mid move watched missed gains. That is the cost of chaos. On my side were level visualization precise timing of entry on the next candle and disciplined execution. The outcome is a predictable process and steady realization of the move’s potential without chasing or drama.


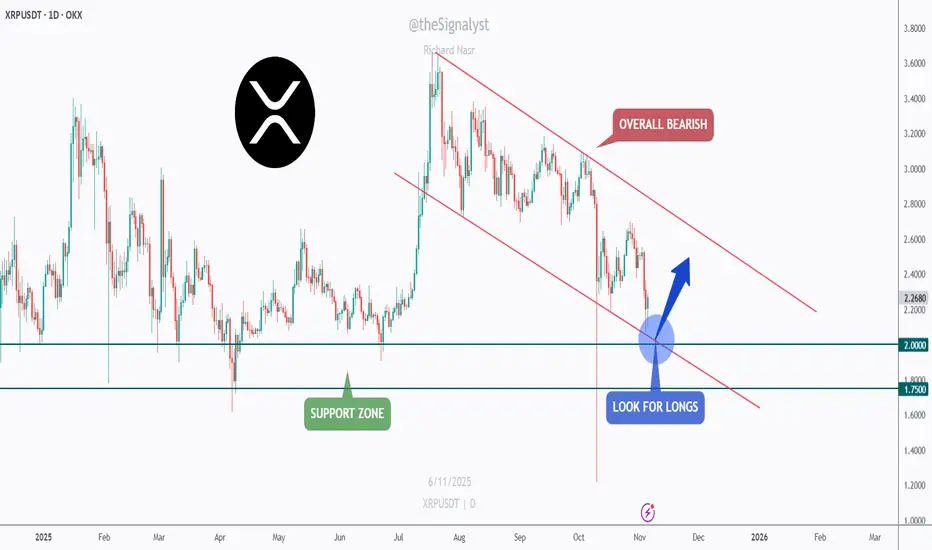
XRP - Watching the Confluence Zone for a Bullish Rebound!📉XRP has been in a clear bearish channel for months , forming consistent lower highs and lower lows.
However, the current structure is approaching a critical confluence zone, where the lower bound of the red channel meets the major green support area between $1.75 and $2.00.
⚔️As long as this intersection holds, I’ll be looking for potential long opportunities, anticipating a short-term bullish correction toward the upper boundary of the channel.
This setup offers a clean risk-to-reward opportunity if the bulls manage to defend the zone and regain momentum.
If the support gives way, further downside could follow, but for now, this area remains a key decision point for XRP’s next move.
⚠️ Disclaimer: This is not financial advice. Always do your own research and manage risk properly.
📊All Strategies Are Good; If Managed Properly!
~Richard Nasr
XRP/USDT: Bearish Channel Holds as Price Struggles Below $2.50XRP/USDT continues to trade below the descending trendline inside a clear downward channel, maintaining a bearish structure. The recent rejection at the $2.44 zone signals ongoing weakness, with price unable to break higher.
As long as it stays below the $2.50 resistance, a move back toward $2.00 support remains likely. Momentum favors a gradual drift lower, keeping short-term bearish pressure in place.
⚠️ Risks:
– A Bitcoin rally could lift altcoins and disrupt the setup.
– Regulatory news around XRP may increase volatility.
– U.S. macro shifts could impact USD strength and XRP flow.

Next volatility period: Around November 26
Hello, traders!
Follow me to get the latest information quickly.
Have a great day!
-------------------------------------
(XRPUSDT 1D chart)
Currently, the M-Signal on the 1W chart > Price > M-Signal on the 1D chart > M-Signal on the 1M chart.
Additionally, it is attempting to break above the StochRSI 80 indicator.
Therefore, if it finds support near the StochRSI 80 indicator and rises, it is highly likely to enter an uptrend.
The resistance zone is around 3.4037-3.4540, which is the HA-High ~ DOM (60) range.
The above is an interpretation based solely on the 1D chart.
-
The chart above displays support and resistance points drawn on the 1M, 1W, and 1D charts.
This indicates that support and resistance have formed in the 2.9092-3.0361 range.
Therefore, we have identified a zone where we can execute a two-stage sell-off.
This confirmation will be crucial for maintaining a stable psychological state amidst price volatility.
If the price falls to the 1.5-1.9669 range, which is the most important level for maintaining an uptrend, you should watch for an explosive increase in trading volume.
If it shows support, it indicates a buying opportunity.
-
Thank you for reading to the end.
I wish you successful trading.
--------------------------------------------------

XRPUSDT 1D#XRP is moving inside a bullish flag on the daily chart. Consider buying around the support zone. For the bullish scenario, the price must hold inside the flag; therefore, two consecutive daily candle closes below the flag will invalidate this analysis.
In case of a successful bounce from the support zone, the short-term target is:
🎯 $2.5777
And in case of a breakout above the daily SMA200 and the flag resistance, the next potential targets are:
🎯 $2.7845
🎯 $2.9913
🎯 $3.2471
🎯 $3.6607
⚠️ Always use a tight stop-loss and apply proper risk management.

XRP. USDTRipple performs best on the weekly timeframe, and this is not just my opinion, all signs point to an upward trend.
ripple pushing custody as a service because when banks custody your coins on top of xrp they are not dumping they are parking. so yeah market is red but a 40b enterprise building rails around a 20 something billion token smells like future upside to me too.

XRPUSDT.P - November 13, 2025Testing out the sell signal generated by my personal minimalist buy and sell signal indicator (signals by miljedtothemoon v1) on the XRPUSDT.P (5-minute chart).
Yesterday, the indicator printed two winning trades — one on a buy (long) signal and one on a sell (short) signal. Let’s see if it works out today.
Disclaimer: This tool is still a work in progress and not 100% reliable. The signals can be high-risk and may produce false entries or exits.
This is for personal and educational purposes only — not financial advice, an advertisement, or a promotion.

$XRP Trendline Breakdown – Support Crucial for Reversal?BINANCE:XRPUSDT CRYPTOCAP:XRP Trendline Breakdown – Support Crucial for Reversal?
Current trend: XRP's in a bearish slide along the descending trendline, now testing the 2.39 support after rejection from 2.59 highs—sellers in command, but thinning volume suggests potential exhaustion 🛡️.
Hold support? Even odds yes; prior bounces and EMA confluence could ignite a sharp rebound if buyers defend the zone.
Breakout above resistance? Needs 2.59 close to flip trendline bullishly—could rally 5-7% to 2.70 if BTC stabilizes 🚀.
Dip risk? Elevated to 2.30 on break, accelerating downside momentum.
Target: Bounce to 2.50 on hold; downside 2.25 buffer.
Indicators tracking: RSI (38, oversold territory), Trendline integrity, and MACD bear divergence 📉.
#XRPTrading #CryptoSupport #AltcoinPioneers

$XRP Support Siege – Flip to Bulls on Hold?BINANCE:XRPUSDT CRYPTOCAP:XRP Support Siege – Flip to Bulls on Hold?
Current trend: XRP's in a corrective slide, probing the sturdy 2.31 support after topping out near 2.56 resistance—low-volume wicks suggest exhaustion, with alts eyeing a relief rally 🛡️.
Hold support? Solid odds yes; doji formations and volume pickup on greens signal buyers loading up for defense.
Breakout above resistance? On deck if closes over 2.56—could spark 5-7% rip to fresh highs 🚀.
Dip risk? Low-moderate to 2.25 on BTC drag, but MACD divergence limits downside.
Target: Near-term 2.55 retest, then 2.70 if momentum flips.
Indicators tracking: MACD for crossover signals, RSI (hovering 42) for oversold snapback, and VWAP as pivot 📊.
#XRPTrading #AltcoinRebound #CryptoSupport

$XRP Holding the Line?BINANCE:XRPUSDT CRYPTOCAP:XRP Holding the Line?
XRP is consolidating in a tight range after a strong rebound, currently testing key support at ~$2.10.
The trend looks bullish short-term if it holds here—volume spikes suggest accumulation, not capitulation.
Breakout above $2.55 resistance could target $2.70-$2.85 next, fueled by momentum.
But watch for a deeper dip to $1.95 if support cracks on low volume.
Key indicators: RSI at 55 (neutral, room to run), 50 EMA as dynamic support, and rising MACD histogram.
Stay vigilant! 📈🔍
#XRP #CryptoAnalysis #TradingView

BTC LONGS!!The Crypto Market Is Pulling Back… But This Changes Nothing! Im looking for longs on BTC!!
In this video, I break down the current crypto move to the downside and why I still believe this is a healthy pullback, not the start of a bearish trend. I’ve been talking about this setup for weeks — and it’s unfolding exactly as planned.
Here’s what I cover:
-Analysis of Total Market Cap, BTC, ETH, and XRP
-CME Gap finally filled — what that means for price action
-Why this could be the perfect area for high-risk long setups
-What I’m looking for next and how I’m planning my next trades
⚠️ Disclaimer:
I am not a financial advisor. The content shared on this channel is for educational and informational purposes only and should not be considered financial advice.
Trading and investing in cryptocurrency involve high risk — you could lose some, or all, of your money. Always do your own research and make sure you understand the risks before making any financial decisions.
