Zcash - Time to buy again!The price on the 6h timeframe is within an ascending triangle, which can be promising. If the price breaks this pattern with bullish candles, it could easily rise by the distance of AB=CD.
Market insights

DeGRAM | ZECUSD fell below $400📊 Technical Analysis
● ZEC/USD trades within a broader descending structure, with price repeatedly rejected from the falling resistance line after forming a series of bearish continuation patterns (falling wedge breakdown, flags, and channels). Each rebound shows weaker momentum, confirming sellers’ control.
● The latest consolidation below the resistance line suggests distribution, with downside pressure building toward the horizontal support near 300–310. A clean breakdown would open room for continuation toward lower trendline support.
💡 Fundamental Analysis
● ZEC remains pressured by weak demand for privacy-focused coins and a risk-off tone across altcoins, keeping speculative flows limited.
✨ Summary
● Bearish structure intact. Key resistance: falling trendline near 420–440. Support target: 300–310, with further downside if support fails.
-------------------
Share your opinion in the comments and support the idea with a like. Thanks for your support!

ZECUSDT: Bearish Drop to 354?BINANCE:ZECUSDT is eyeing a bearish continuation on the 4-hour chart , with price testing the upper boundary of a descending channel after forming lower highs, converging with a potential entry zone near resistance that could spark downside momentum if sellers defend amid recent volatility. This setup suggests a pullback opportunity in the downtrend, targeting lower support levels with strong risk-reward exceeding 1:5 .🔥
Entry between 450–458 for a short position (entry from current price with proper risk management is recommended). Target at 354 . Set a stop loss at a daily close above 470 , yielding a risk-reward ratio of more than 1:5 . Monitor for confirmation via a bearish candle close below entry with rising volume, leveraging the channel's bearish bias.🌟
📝 Trade Setup
🎯 Entry (Short):
450 – 458
(Entry from current levels is valid with strict risk & position management)
🎯 Target:
• 354
❌ Stop Loss:
• Daily close above 470
⚖️ Risk-to-Reward:
• > 1:5
💡 Your view?
Does ZEC reject the channel top and flush toward 354 — or will buyers force a deeper correction?
👇 Share your thoughts below! 👇

ZEC Breakdown in Play — React or Get Left BehindYello, did you see the textbook rejection right at the supply zone... or are you already late to the move?
💎#ZECUSDT just gave a clear signal, and if you're not paying close attention, this could be the start of a much deeper breakdown that catches most traders off guard.
💎After completing a clean breakdown from the rising wedge pattern, the price returned for a precise retest... and failed. The rejection right at the $400–$420 supply zone confirms it. That level was a critical resistance where bulls had their final shot to reclaim momentum — but they failed to flip the structure.
💎Now, unless ZEC rapidly reclaims the wedge breakout level, the path of least resistance is clearly down. While there’s a minor support forming near $328, it’s weak and unlikely to hold under sustained selling pressure.
💎 A drop toward the stronger support zone between $285 and $272 is where we expect a real reaction. Only a decisive reclaim above $437 would invalidate this bearish setup and suggest the bulls are back in control.
Discipline, patience, and strategy always win.
MyCryptoParadise
iFeel the success🌴

ZECUSDT is preparing for a local rally Focus on the resistance triangle or liquidity zone 457.78 - 470.0. For several days, the market has been building up potential ahead of the zone, which is likely to be directed towards breaking through the border. Closing above 470.0 will be a strong signal for growth.
Consolidation continues, forming a bullish structure in which the market does not update its lows.
A U-formation with consolidation (cup with handle) is forming on the chart.
Scenario: Before breaking through resistance, there may be a short squeeze at 420.0. However, breaking through the 457-470 zone and closing above it will lead to growth to 547.

ZEC minor pull back in playZEC had a nice run up from 18 December's $383 to today's $457, and I expect a cup and handle to form, with the most likely retrace to 426.50 followed by potential wicks or pressure at $417, and $412.

$ZEC is ready to flyZcash’s rally combines technical momentum, network upgrades addressing real usability issues, and strategic institutional positioning in a privacy-focused market. While the ETF narrative remains aspirational, the fee reform proposal and shielded transaction growth (30% of supply) suggest fundamental progress

Lingrid | ZECUSDT Trendline Under Pressure - Major Drop PossibleBINANCE:ZECUSDT perfectly played out my previous trading idea . Price continues to grind sideways beneath a descending resistance, while repeatedly leaning on the rising trendline for support. Each bounce from this structure looks weaker, and the latest reaction formed another lower high, reinforcing bearish control. Price remains capped inside the 460 supply band, where sellers have consistently absorbed upside attempts.
If the upward trendline gives way, price could accelerate sharply lower, with momentum likely expanding toward the 310 support, where the prior lower low and demand zone converge. Such a move would mark a decisive breakdown rather than a simple pullback.
➡️ Primary scenario: trendline break → sell-off toward 310.
⚠️ Risk scenario: a sustained hold above 480 may invalidate the breakdown setup and force a deeper consolidation instead.
If this idea resonates with you or you have your own opinion, traders, hit the comments. I’m excited to read your thoughts!

ZECUSDT is targeting 550$ to 650$ once againThe technical structure for ZECUSDT presents two primary scenarios, both of which maintain an underlying bullish bias:
Scenario 1: Direct Breakout
Trigger: A decisive breakout and sustained close above the $480 - $500 resistance zone, confirmed by increasing volume.
Target: This would signal strong immediate buying pressure, with a measured move projecting an initial target near $650.
Scenario 2: Correction Before Rally
Trigger: A rejection from the $480 - $500 resistance zone, leading to a corrective pullback.
Path: The pullback could find support near the $250 level, which aligns with a key higher-timeframe support zone.
Target: A subsequent bullish reversal from $250 would then target a rally toward the $550 area.
In both cases, the overall market structure for ZECUSDT is interpreted as bullish. The difference lies in the market's chosen path: either continuing its momentum directly or undergoing a deeper correction to gather strength before the next significant upward move.

ZCASH/USDT Technical Outlook
ZEC is forming a rising wedge pattern — typically a bearish structure in downtrends.
📌 Price is currently around $442.44
🔻 A breakdown below support could target:
🎯 T1: $289.62

ZEC Sell/Short Setup (1H)Use this setup as a scalp, not a swing trade.
Since price has reacted to a major supply zone and has formed a CP pattern below the supply, a drop is expected.
Make sure to move your stop to breakeven at the first target.
The targets are clearly marked on the chart.
For risk management, please don't forget stop loss and capital management
When we reach the first target, save some profit and then change the stop to entry
Comment if you have any questions
Thank You

ZECUSDTWe have a bearish momentum as seen on the left 4h tf. But Price is making a new trend creating series of Higher highs and Higher lows. I expect the price to bounce on the CHoC for another leg up.

Zec Extremely Bullish As previous analysis for Zec we saw a little retracement to 371 and then go up more. the next target for ZEC is 555. let see when riches this target .

FireHoseReel | ZEC at a Critical Range Breakout Ahead🔥 Welcome To FireHoseReel !
Let’s dive into ZCash (ZEC) analysis.
⛳️ ZEC Fundamental Overview
Zcash (ZEC) is a long-standing privacy-focused cryptocurrency, usually ranked around #16 on CoinMarketCap, enabling users to send private, non-traceable transactions with strong cryptographic privacy.
👀 ZEC 4H Overview
On the 4-hour timeframe, ZEC is trading inside a range box with resistance at $457 and support at $374. Price has reached the upper-middle area of this range, and a breakout above the range high or the midline could drive the next move toward the following resistance or support level.
📊 Volume Analysis
Zcash volume has declined over the past few days, but in the last few hours buyers have shown strength by forming a higher low. A strong volume blow-off candle has entered the market, indicating renewed buying interest.
✍️ ZEC Trading Scenarios
🟢 Long Scenario:
ZEC is currently pressing against the mentioned resistance. A breakout above this level, supported by increasing buying volume and RSI crossing above the 70 momentum threshold into overbought territory, could confirm the breakout and open the path toward the next resistance.
🔴 Short Scenario:
A breakdown below the box midline at $374, accompanied by visible selling pressure and RSI dropping below the 33 momentum zone, could trigger a move down toward the next support level.
🧠 Protect your capital first. No setup is worth blowing your account. If risk isn’t controlled, profit means nothing. Trade with rules, not emotions.

$ZEC 12H CHART UPDATE📌 CRYPTOCAP:ZEC is currently forming a harmonic structure, but the setup is NOT complete yet ✅
📌 Price still needs to drop into the strong support zone below. Without touching support, no clean move can start ✅
📌 The most important part is how price reacts at the support zone. It must hold the zone and retest it properly ✅
📌 For price to move up from that support, I want to see some basic confirmations:
– RSI should start moving up from weak levels (no strength = no rally)
– MACD should show momentum shift toward bullish side
– Volume must increase on bullish candles (no volume = fake move)
📌 If support holds and these confirmations appear, then upside targets can open step by step 🔥
300 → 350 → 400 → 500 → 600 → 700+
📌 Final conclusion:
🔴No support touch = wait
🚀Support hold + confirmation = opportunity
#ZEC #Zcash #TradingView #TechnicalAnalysis #CryptoTrading
#RSI #MACD #SupportResistance #PriceAction

ZEC Sell/Short Signal (4H)The overall trend of ZEC is clearly bearish.
A bullish move occurred to collect liquidity, and the price has now been rejected. A deep drop is expected.
We have identified two specific entry points where positions should be built using a DCA strategy. The targets have been marked on the chart.
Do not enter the position without capital management and stop setting
Comment if you have any questions
thank you

ZEC long to 545This is a old trade I hold from the range as seen on the post, we are going under my entry probably before pushing higher. I think that a good entry is around 360.

is it a fakeout for a price up swing?trading ZEC is very intresting, volatility is high, price gap is wide, volume is consistent.
if the current marker is a fakeout. expect prices above 500 - 600 or even above 700 if there is a squeeze.

Zcash Analysis: $615 next? In my view, the recent high around $750 marks the local top for Zcash in this cycle. I don't expect it to retest or surpass its all-time highs (far above current levels) unless Bitcoin turns strongly bullish and kicks off a rapid altcoin season.The major gains from this run seem largely realized, and what we're seeing now resembles a classic "dead cat bounce" after the sharp pullback from the November peak (~$744).That said, locally, Zcash still looks constructive.
Price is approaching a potential apex in its current structure and could be setting up for a short-term upside breakout — provided overall market sentiment stays positive (i.e., Bitcoin breaks higher to provide the necessary momentum).As shown on the chart:Multiple daily resistance levels are marked — these make ideal potential sell zones for taking profits.
Ultimately, how far you let it run depends on your greed tolerance.
In the most bullish local scenario, I could see ZEC pushing to the weekly resistance around $615. All the daily levels en route would need to be cleared for that to play out, acting as intermediate hurdles.
Trade safe, and manage risk!

ZEC Sell/Short Signal (1H)Given that price has reached a higher-timeframe supply zone and is currently ranging on the 1-hour timeframe, we can look for Sell/Short positions as price approaches the supply area.
Make sure to take partial profits at the first target, then move the stop-loss to breakeven.
Do not enter the position without capital management and stop setting
Comment if you have any questions
thank you

ZCASH BULLISH POTENTIAL Looks like small correction is done.
= Resistance is around (472 and 546)
= Support trendline and 390 price range

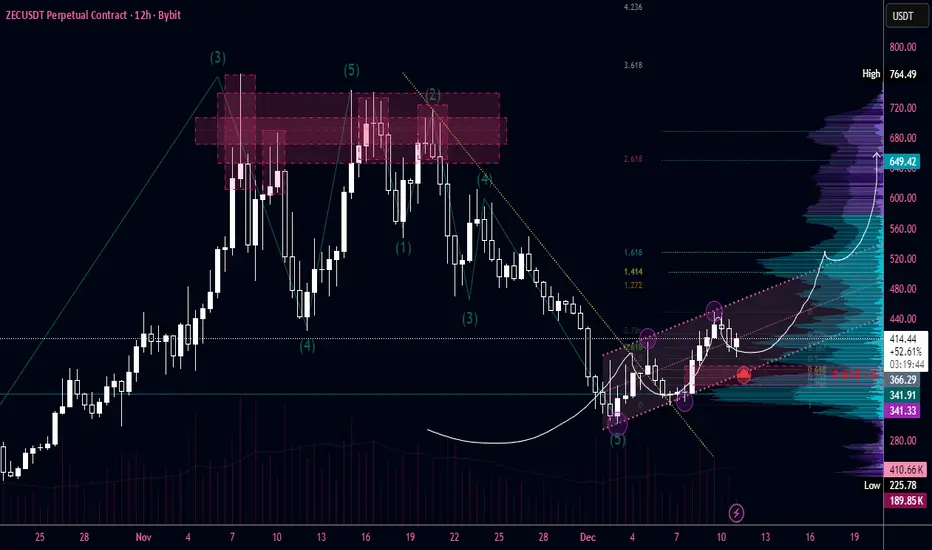
#ZEC — R:R 1:11 Target to update 765 from currentBINANCE:ZECUSDT.P
A very promising asset with a trending movement.
All assets are currently in roughly the same situation.
Here, the price has completed its wave cycle and is beginning to reverse to renew the 765 high. We cannot be sure whether it will be renewed or not.
But this is an excellent entry point to take 2 take. I am sure that the price will work out the POE level and exit the channel. The chart shows frequent touches of the channel walls.
After the resistance wall, the price is lazily moving towards its FVG, which it created through momentum. There is a break in the structure, entry from FVG 0.618 - 0.702 (exactly in the middle of FVG 12H).
Even if we don't manage to open a position, we have two targets and can open a position after the channel breaks on a retest and still have a good RR. In this trade with my POE, it is 1/11. I will be patient.
At the 1.618 - 1.272 Fibonacci level zone, there is a large HVN, followed by an equally important one at 2.618 with very strong resistance and liquidity, where the price is likely to go without difficulty.
I set small stops in such cases because I plan to go far on the price. In case of a breakout of 0.702-0.786 and the absence of a sharp impulse in the long, I would prefer not to open a position.
ZEC Analysis (4H)The bullish and upward structure of ZEC appears to be completed, and from the point where we placed the red arrow on the chart, its bearish phase seems to have begun.
It now looks like we are in wave B of the bearish phase, and it is expected to drop from the red zone toward the targets marked on the chart.
The targets are clearly indicated on the chart.
A daily candle closing above the invalidation level will invalidate this analysis.
For risk management, please don't forget stop loss and capital management
When we reach the first target, save some profit and then change the stop to entry
Comment if you have any questions
Thank You
