ZROUSDT Chart Anlaysis W 13-Dec-25Stop Loss: 0.330
Entry Price: 2.558
Take Profit 1: 4.834
Take Profit 2: 7.078
On the weekly chart, a Falling Wedge pattern has formed, indicating a potential shift in trend from bearish to bullish. The suggested entry is at 2.558, with expectations for the price to move toward the projected take-pr

#ZRO/USDT could be another strong contender
#ZRO
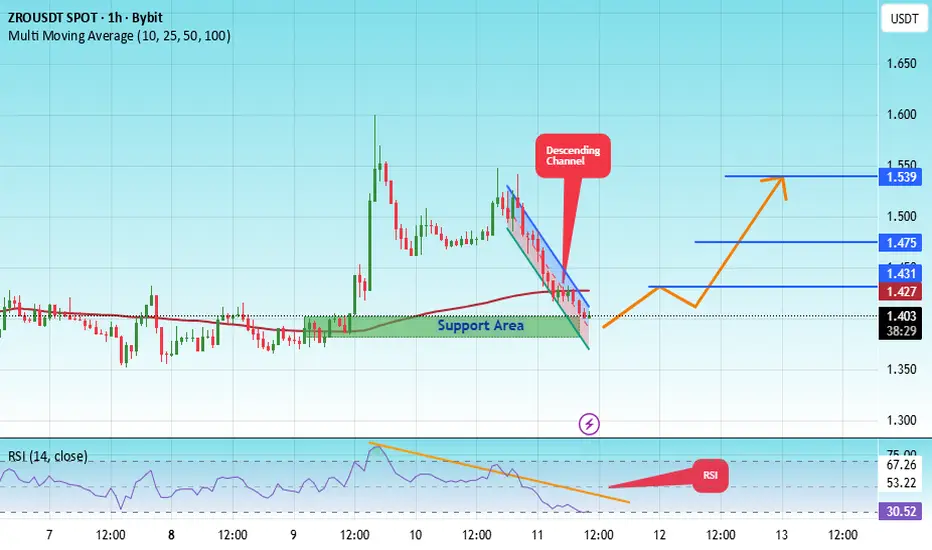
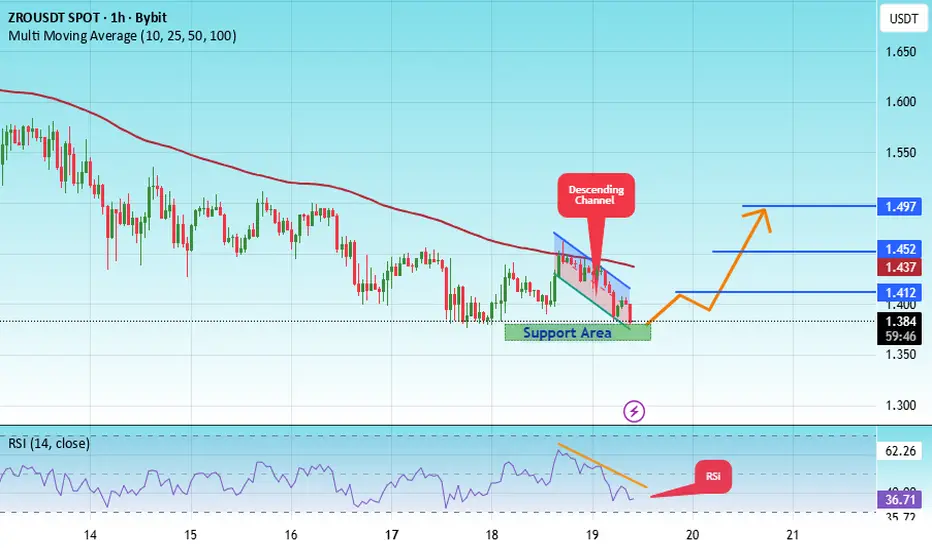
The price is moving in a descending channel on the 1-hour timeframe. It has reached the lower boundary and is heading towards breaking above it, with a retest of the upper boundary expected.
We have a downtrend on the RSI indicator, which has reached near the lower boundary, and an upward re
#ZRO/USDT could be another strong contender#ZRO
The price is moving in a descending channel on the 1-hour timeframe. It has reached the lower boundary and is heading towards a breakout, with a retest of the upper boundary expected.
We are seeing a bearish bias in the Relative Strength Index (RSI), which has reached near the lower boundary,

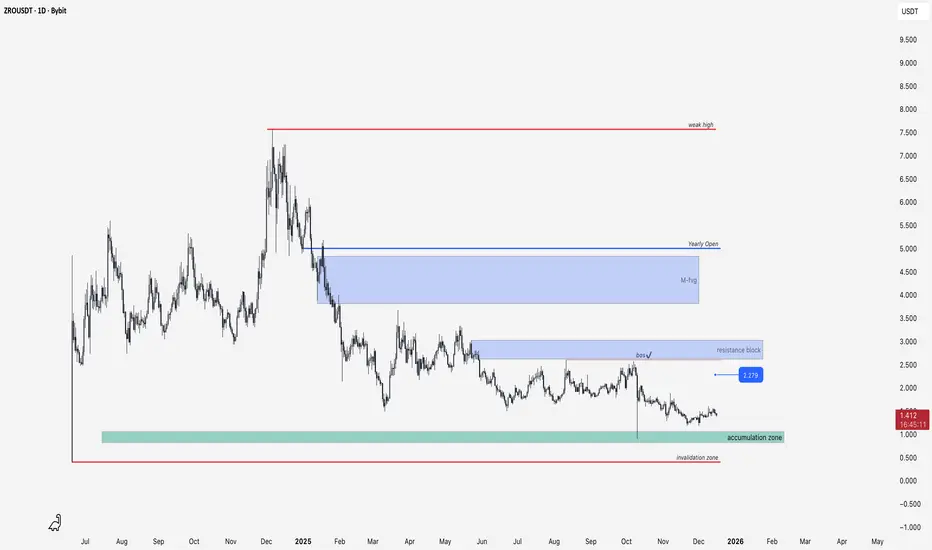
ZRO Post-Listing Power: Retest Accumulation & Bullish BreakoutZRO looks pretty decent after the listing compared to the charts of tokens that were added to exchanges at the same time! BYBIT:ZROUSDT
Technically, we've reached the Initiation Accumulation Distribution phase up to the last accumulation zone! But it's always profitable to start DCA here.
Invali
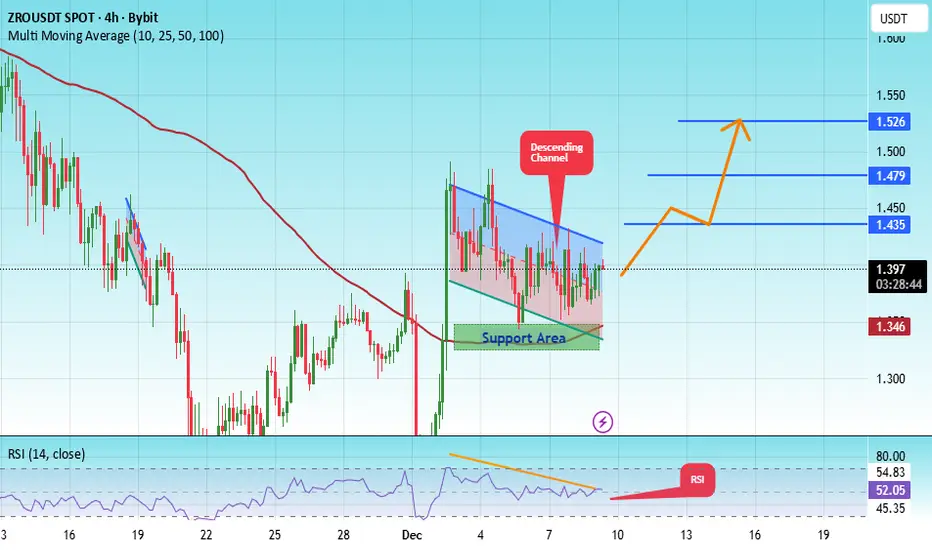
ZRO Weakness Into 4H FVG — Watching for Reversal Toward $1.50ZRO / USDT is showing weakness and continues to decline toward the 4H FVG zone at $1.24–$1.21. This area will be important to watch for a potential reaction. If price shows strength from this FVG, a reversal toward $1.50 can follow. Manage risk wisely and wait for confirmation.

#ZRO/USDT could be another strong contender#ZRO
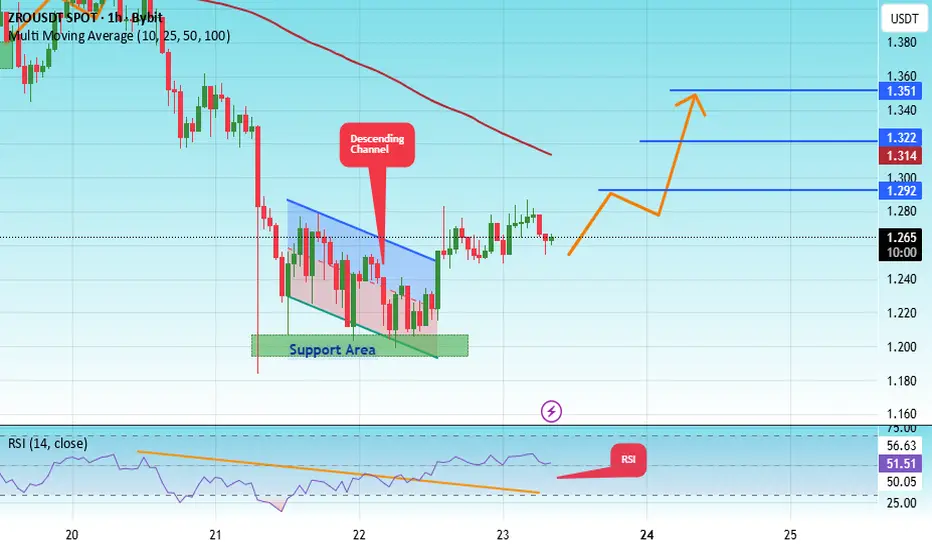
The price is moving in a descending channel on the 1-hour timeframe. It has reached the lower boundary and is heading towards breaking above it, with a retest of the upper boundary expected.
We have a downtrend on the RSI indicator, which has reached near the lower boundary, and an upward reb
ZROUSDT 1D#ZRO has broken above the falling wedge resistance on the daily chart. It has been rejected from the Ichimoku cloud and is now pulling back to retest the wedge. In case of a successful retest — in other words, a bounce — we can expect the following targets:
🎯 $1.649
🎯 $1.799
🎯 $1.948
🎯 $2.160
🎯 $2.

#ZRO/USDT could be another strong contender#ZRO
The price is moving within an ascending channel on the 1-hour timeframe and is adhering to it well. It is poised to break out strongly and retest the channel.
We have a downtrend line on the RSI indicator that is about to break and retest, which supports the upward move.
There is a key suppo
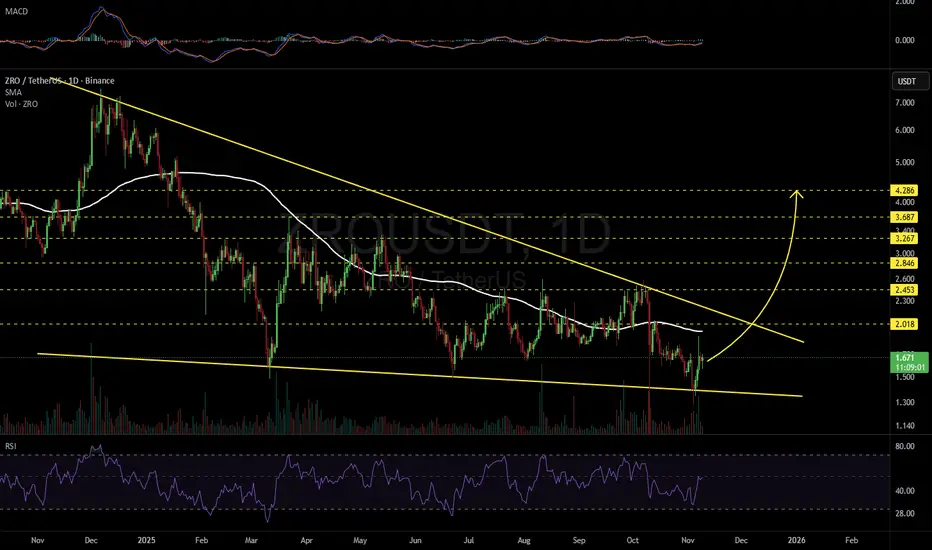
ZROUSDT 1D#ZRO is currently trading within a falling wedge pattern on the daily timeframe. In case of a breakout above the daily SMA100 and the wedge resistance, the potential upside targets are:
🎯 $2.018
🎯 $2.453
🎯 $2.846
🎯 $3.267
🎯 $3.687
🎯 $4.286
⚠️ Always remember to use a tight stop-loss and maintain p
See all ideas
Summarizing what the indicators are suggesting.
Oscillators
Neutral
SellBuy
Strong sellStrong buy
Strong sellSellNeutralBuyStrong buy
Oscillators
Neutral
SellBuy
Strong sellStrong buy
Strong sellSellNeutralBuyStrong buy
Summary
Neutral
SellBuy
Strong sellStrong buy
Strong sellSellNeutralBuyStrong buy
Summary
Neutral
SellBuy
Strong sellStrong buy
Strong sellSellNeutralBuyStrong buy
Summary
Neutral
SellBuy
Strong sellStrong buy
Strong sellSellNeutralBuyStrong buy
Moving Averages
Neutral
SellBuy
Strong sellStrong buy
Strong sellSellNeutralBuyStrong buy
Moving Averages
Neutral
SellBuy
Strong sellStrong buy
Strong sellSellNeutralBuyStrong buy